Postal Code 1440 - Belgium
Belgium
| Area of Postal Code 1440 | 22.8 km² |
| Population | 11,375 |
| Male Population | 5,525 (48.6%) |
| Female Population | 5,850 (51.4%) |
| Population change from 1975 to 2020 | +43.7% |
| Population change from 2000 to 2020 | +30.2% |
| Median Age | 42.3 years |
| Male Median Age | 41.3 years |
| Female Median Age | 43.2 years |
| Timezone | Central European Summer Time |
| Coordinates | 50.679653704942226° / 4.284205149784842° |
| Related Postal Codes | 1401, 1402, 1404, 1410, 1414, 1420, 1421, 1428, 1430, 1435 |
Map of Postal Code 1440 - Belgium
Interactive Map
Postal Code 1440 - Belgium Population
Years 1975 to 2030
| Data | 1975 | 1990 | 2000 | 2015 | 2020 | 2025* | 2030* |
|---|---|---|---|---|---|---|---|
| Population | 7,918 | 8,378 | 8,737 | 9,630 | 11,375 | 11,650 | 11,788 |
| Population Density | 346.9 / km² | 367.1 / km² | 382.8 / km² | 422 / km² | 498.4 / km² | 510.5 / km² | 516.5 / km² |
* Projected
Sources: JRC (European Commission's Joint Research Centre) work on the GHS built-up gridPostal Code 1440 - Belgium Population change from 2000 to 2020
Increase of 30.2% from year 2000 to 2020
| Location | Change since 1975 | Change since 1990 | Change since 2000 |
|---|---|---|---|
| Postal Code 1440 - Belgium | +43.7% | +35.8% | +30.2% |
| Belgium | — | — | — |
Sources: JRC (European Commission's Joint Research Centre) work on the GHS built-up grid
Postal Code 1440 - Belgium Median Age
Median Age: 42.3 years
| Location | Median Age | Median Age (Female) | Median Age (Male) |
|---|---|---|---|
| Postal Code 1440 - Belgium | 42.3 yrs | 43.2 yrs | 41.3 yrs |
| Belgium | 41.4 yrs | 42.5 yrs | 40.3 yrs |
Sources: CIESIN (Center for International Earth Science Information Network)
Postal Code 1440 Population Density
Population Density: 498 / km²
| Location | Population | Area | Density |
|---|---|---|---|
| Postal Code 1440 | 11,375 | 22.8 km² | 498 / km² |
| Belgium | 11.3 million | 30,664.8 km² | 368 / km² |
Sources: JRC (European Commission's Joint Research Centre) work on the GHS built-up grid
Postal Code 1440 - Belgium Historical and Projected Population
Estimated Population from 1100 to 2100
Sources:
- JRC (European Commission's Joint Research Centre) work on the GHS built-up grid
- CIESIN (Center for International Earth Science Information Network)
- [Link] Klein Goldewijk, K., Beusen, A., Doelman, J., and Stehfest, E.: Anthropogenic land use estimates for the Holocene – HYDE 3.2, Earth Syst. Sci. Data, 9, 927–953, https://doi.org/10.5194/essd-9-927-2017, 2017.
Area Codes
Percentage Area Codes used by businesses in Postal Code 1440 - Belgium
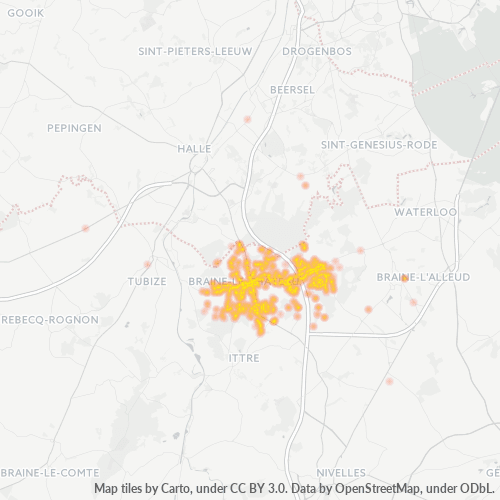
Business Concentration in Postal Code 1440 - Belgium
Industries
Business Distribution by Industry in Postal Code 1440 - Belgium
| Industry Description | Number of Establishments | Average Age of Business |
|---|---|---|
| Accountants | 66 | 28.8 years |
| Beauty salons | 31 | — |
| Corporate management | 71 | 26.9 years |
| Electrical installation | 47 | 28.6 years |
| Health and medical | 77 | 18.8 years |
| Physiotherapy | 46 | — |
| Renovation of buildings | 32 | — |
| Restaurants | 58 | 19.7 years |
| Shopping | 53 | 22.3 years |
| Sports other | 51 | — |
Business distribution by price for Postal Code 1440 - Belgium
Human Development Index (HDI)
Statistic composite index of life expectancy, education, and per capita income.
Source: [Link] Kummu, M., Taka, M. &Guillaume, J. Gridded global datasets for Gross Domestic Product and Human Development Index over 1990–2015. Sci Data 5, 180004 (2018) doi:10.1038/sdata.2018.4
Postal Code 1440 - Belgium Gross Domestic Product (GDP)
GDP per capita, PPP (constant 2017 international $)
| Data | 1990 | 1995 | 2000 | 2005 | 2010 | 2015 | 2020 | 2022 |
|---|---|---|---|---|---|---|---|---|
| GDP per capita | $38,849 | $41,281 | $46,868 | $50,361 | $52,041 | $54,851 | $53,032 | $59,398 |
| Total GDP | $1.7B | $1.8B | $2.1B | $2.4B | $2.5B | $2.8B | $2.7B | $3.1B |
Source: [Link] Kummu, M., Kosonen, M. & Masoumzadeh Sayyar, S. Downscaled gridded global dataset for gross domestic product (GDP) per capita PPP over 1990–2022. Sci Data 12, 178 (2025) doi:10.1038/s41597-025-04487-x
Postal Code 1440 CO2 Emissions
Carbon Dioxide (CO2) Emissions Per Capita in Tonnes Per Year
| Location | CO2 Emissions | CO2 Emissions Per Capita | CO2 Emissions Intensity |
|---|---|---|---|
| Postal Code 1440 | 100,709 tn | 8.85 tn | 4,412.8 tons/km² |
| Belgium | 92,691,347 tn | 8.22 tn | 3,022.7 tons/km² |
Sources: [Link] Moran, D., Kanemoto K; Jiborn, M., Wood, R., Többen, J., and Seto, K.C. (2018) Carbon footprints of 13,000 cities. Environmental Research Letters DOI: 10.1088/1748-9326/aac72a
Postal Code 1440 CO2 Emissions
| 2013 CO2 emissions (tonnes/year) | 100,709 tn |
| 2013 CO2 emissions (tonnes/year) per capita | 8.85 tn |
| 2013 CO2 emissions intensity (tonnes/km²/year) | 4,412.8 tons/km² |
Natural Hazards Risk
Relative risk out of 10
| Hazard | Risk Level |
|---|---|
| Flood | Medium (7) |
| Earthquake | Low (3) |
* Risk, particularly concerning flood or landslide, may not be for the entire area.
Recent Nearby Earthquakes
Magnitude 3.0 and greater
| Date▼ | Time↕ | Magnitude↕ | Distance↕ | Depth↕ | Location↕ | Link |
|---|---|---|---|---|---|---|
| 9/12/08 | 6:14 PM | 3.3 | 56.7 km | 5,000 m | Belgium | usgs.gov |
| 7/13/08 | 6:45 AM | 3.8 | 21.3 km | 4,000 m | Belgium | usgs.gov |
| 7/13/08 | 6:33 PM | 3.2 | 45.4 km | 4,000 m | Belgium | usgs.gov |
| 2/27/05 | 12:16 AM | 3.1 | 93.4 km | 4,000 m | France | usgs.gov |
| 6/19/95 | 6:54 PM | 4.3 | 34.7 km | 20,000 m | Belgium | usgs.gov |
| 7/20/94 | 11:01 AM | 3.1 | 40.7 km | 5,000 m | Belgium | usgs.gov |
| 7/20/94 | 11:01 AM | 3.5 | 47.3 km | 5,000 m | Belgium | usgs.gov |
| 8/29/92 | 2:22 AM | 4.1 | 53.1 km | 17,900 m | Belgium | usgs.gov |
| 8/26/92 | 4:41 PM | 3.9 | 60.7 km | 10,000 m | Belgium | usgs.gov |
| 8/10/91 | 7:55 AM | 3.2 | 91.1 km | 10,000 m | Belgium | usgs.gov |
Showing 1-10 of 26
Source: U.S. Geological Survey (USGS)
About Our Data
The data on this page is estimated using a number of publicly available tools and resources. It is provided without warranty, and could contain inaccuracies. Use at your own risk.