Postal Code 4052 - Belgium
Belgium
| Area of Postal Code 4052 | 8.3 km² |
| Population | 5,528 |
| Male Population | 2,637 (47.7%) |
| Female Population | 2,891 (52.3%) |
| Population change from 1975 to 2015 | +27.3% |
| Population change from 2000 to 2015 | +11.4% |
| Median Age | 46.3 years |
| Male Median Age | 44.2 years |
| Female Median Age | 48.3 years |
| Neighborhoods | Centre |
| Timezone | Central European Summer Time |
| Coordinates | 50.56165528834867° / 5.6374738613504345° |
| Related Postal Codes | 4000, 4020, 4030, 4031, 4032, 4040, 4042, 4050, 4051, 4053 |
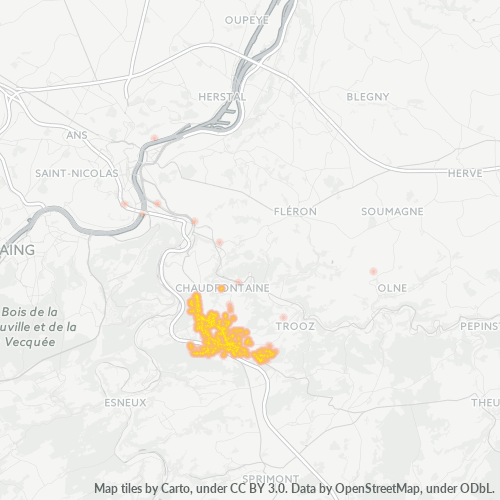
Map of Postal Code 4052 - Belgium
Interactive Map
Postal Code 4052 - Belgium Population
Years 1975 to 2020
| Data | 1975 | 1990 | 2000 | 2015 | 2020 |
|---|---|---|---|---|---|
| Population | 4,341 | 4,776 | 4,964 | 5,528 | 5,677 |
| Population Density | 523.4 / km² | 575.8 / km² | 598.5 / km² | 666.5 / km² | 684.5 / km² |
Sources: JRC (European Commission's Joint Research Centre) work on the GHS built-up grid
Postal Code 4052 - Belgium Population change from 2000 to 2015
Increase of 11.4% from year 2000 to 2015
| Location | Change since 1975 | Change since 1990 | Change since 2000 |
|---|---|---|---|
| Postal Code 4052 - Belgium | +27.3% | +15.7% | +11.4% |
| Belgium | +15.7% | +13.2% | +10% |
Sources: JRC (European Commission's Joint Research Centre) work on the GHS built-up grid
Postal Code 4052 - Belgium Median Age
Median Age: 46.3 years
| Location | Median Age | Median Age (Female) | Median Age (Male) |
|---|---|---|---|
| Postal Code 4052 - Belgium | 46.3 yrs | 48.3 yrs | 44.2 yrs |
| Belgium | 41.4 yrs | 42.5 yrs | 40.3 yrs |
Sources: CIESIN (Center for International Earth Science Information Network)
Postal Code 4052 Population Density
Population Density: 667 / km²
| Location | Population | Area | Density |
|---|---|---|---|
| Postal Code 4052 | 5,528 | 8.3 km² | 667 / km² |
| Belgium | 11.3 million | 30,664.8 km² | 368 / km² |
Sources: JRC (European Commission's Joint Research Centre) work on the GHS built-up grid
Postal Code 4052 - Belgium Historical and Projected Population
Estimated Population from 0 to 2100
Sources:
- JRC (European Commission's Joint Research Centre) work on the GHS built-up grid
- CIESIN (Center for International Earth Science Information Network)
- [Link] Klein Goldewijk, K., Beusen, A., Doelman, J., and Stehfest, E.: Anthropogenic land use estimates for the Holocene – HYDE 3.2, Earth Syst. Sci. Data, 9, 927–953, https://doi.org/10.5194/essd-9-927-2017, 2017.
Business Concentration in Postal Code 4052 - Belgium
Industries
Business Distribution by Industry in Postal Code 4052 - Belgium
| Industry Description | Number of Establishments | Average Age of Business |
|---|---|---|
| Accountants | 68 | 33.4 years |
| Architects | 28 | — |
| Bakeries | 19 | — |
| Beauty salons | 28 | — |
| Corporate management | 38 | 21.9 years |
| Health and medical | 64 | 19.4 years |
| Other construction | 19 | — |
| Physicians and surgeons | 26 | — |
| Real estate | 42 | 28.5 years |
| Restaurants | 46 | — |
| Shopping | 38 | 20.9 years |
| Sports clubs | 21 | — |
| Sports other | 25 | — |
| Technical construction services | 19 | — |
Business distribution by price for Postal Code 4052 - Belgium
Human Development Index (HDI)
Statistic composite index of life expectancy, education, and per capita income.
Source: [Link] Kummu, M., Taka, M. &Guillaume, J. Gridded global datasets for Gross Domestic Product and Human Development Index over 1990–2015. Sci Data 5, 180004 (2018) doi:10.1038/sdata.2018.4
Postal Code 4052 CO2 Emissions
Carbon Dioxide (CO2) Emissions Per Capita in Tonnes Per Year
| Location | CO2 Emissions | CO2 Emissions Per Capita | CO2 Emissions Intensity |
|---|---|---|---|
| Postal Code 4052 | 43,474 tn | 7.86 tn | 5,241.4 tons/km² |
| Belgium | 92,691,347 tn | 8.22 tn | 3,022.7 tons/km² |
Sources: [Link] Moran, D., Kanemoto K; Jiborn, M., Wood, R., Többen, J., and Seto, K.C. (2018) Carbon footprints of 13,000 cities. Environmental Research Letters DOI: 10.1088/1748-9326/aac72a
Postal Code 4052 CO2 Emissions
| 2013 CO2 emissions (tonnes/year) | 43,474 tn |
| 2013 CO2 emissions (tonnes/year) per capita | 7.86 tn |
| 2013 CO2 emissions intensity (tonnes/km²/year) | 5,241.4 tons/km² |
Natural Hazards Risk
Relative risk out of 10
| Hazard | Risk Level |
|---|---|
| Flood | Medium (7) |
| Earthquake | Medium (4) |
* Risk, particularly concerning flood or landslide, may not be for the entire area.
Recent Nearby Earthquakes
Magnitude 3.0 and greater
| Date▼ | Time↕ | Magnitude↕ | Distance↕ | Depth↕ | Location↕ | Link |
|---|---|---|---|---|---|---|
| 9/12/08 | 6:14 PM | 3.3 | 81.1 km | 5,000 m | Belgium | usgs.gov |
| 7/13/08 | 6:45 AM | 3.8 | 75.6 km | 4,000 m | Belgium | usgs.gov |
| 11/24/07 | 7:10 PM | 3.7 | 20.9 km | 13,000 m | Belgium | usgs.gov |
| 11/28/06 | 12:19 AM | 3.1 | 62.3 km | 4,000 m | The Netherlands | usgs.gov |
| 7/17/04 | 4:16 PM | 3.4 | 53.1 km | 13,100 m | Germany | usgs.gov |
| 8/31/02 | 2:28 PM | 3.2 | 37 km | 10,000 m | Belgium | usgs.gov |
| 7/22/02 | 2:09 AM | 3.3 | 32.7 km | 10,000 m | Belgium | usgs.gov |
| 7/22/02 | 5:39 AM | 3.2 | 36.9 km | 10,000 m | Belgium | usgs.gov |
| 7/21/02 | 10:45 PM | 4.8 | 49.1 km | 17,200 m | Germany | usgs.gov |
| 4/22/02 | 2:16 PM | 3.5 | 41.6 km | 10,000 m | Germany | usgs.gov |
Showing 1-10 of 78
…
Source: U.S. Geological Survey (USGS)
About Our Data
The data on this page is estimated using a number of publicly available tools and resources. It is provided without warranty, and could contain inaccuracies. Use at your own risk.