Postal Code 9185 - Belgium
Belgium
| Area of Postal Code 9185 | 34.7 km² |
| Population | 7,778 |
| Male Population | 3,830 (49.2%) |
| Female Population | 3,948 (50.8%) |
| Population change from 1975 to 2020 | +8.3% |
| Population change from 2000 to 2020 | -2.1% |
| Median Age | 43.2 years |
| Male Median Age | 42.5 years |
| Female Median Age | 43.9 years |
| Neighborhoods | Sint-Kruis-Winkel |
| Timezone | Central European Summer Time |
| Coordinates | 51.180255218750695° / 3.873282132609408° |
| Related Postal Codes | 9100, 9111, 9112, 9120, 9130, 9140, 9150, 9160, 9170, 9180 |
Map of Postal Code 9185 - Belgium
Interactive Map
Postal Code 9185 - Belgium Population
Years 1975 to 2030
| Data | 1975 | 1990 | 2000 | 2015 | 2020 | 2025* | 2030* |
|---|---|---|---|---|---|---|---|
| Population | 7,180 | 7,618 | 7,947 | 8,754 | 7,778 | 7,977 | 8,122 |
| Population Density | 207 / km² | 219.6 / km² | 229.1 / km² | 252.4 / km² | 224.3 / km² | 230 / km² | 234.2 / km² |
* Projected
Sources: JRC (European Commission's Joint Research Centre) work on the GHS built-up gridPostal Code 9185 - Belgium Population change from 2000 to 2020
Decrease of 2.1% from year 2000 to 2020
| Location | Change since 1975 | Change since 1990 | Change since 2000 |
|---|---|---|---|
| Postal Code 9185 - Belgium | +8.3% | +2.1% | -2.1% |
| Belgium | — | — | — |
Sources: JRC (European Commission's Joint Research Centre) work on the GHS built-up grid
Postal Code 9185 - Belgium Median Age
Median Age: 43.2 years
| Location | Median Age | Median Age (Female) | Median Age (Male) |
|---|---|---|---|
| Postal Code 9185 - Belgium | 43.2 yrs | 43.9 yrs | 42.5 yrs |
| Belgium | 41.4 yrs | 42.5 yrs | 40.3 yrs |
Sources: CIESIN (Center for International Earth Science Information Network)
Postal Code 9185 Population Density
Population Density: 224 / km²
| Location | Population | Area | Density |
|---|---|---|---|
| Postal Code 9185 | 7,778 | 34.7 km² | 224 / km² |
| Belgium | 11.3 million | 30,664.8 km² | 368 / km² |
Sources: JRC (European Commission's Joint Research Centre) work on the GHS built-up grid
Postal Code 9185 - Belgium Historical and Projected Population
Estimated Population from 1500 to 2100
Sources:
- JRC (European Commission's Joint Research Centre) work on the GHS built-up grid
- CIESIN (Center for International Earth Science Information Network)
- [Link] Klein Goldewijk, K., Beusen, A., Doelman, J., and Stehfest, E.: Anthropogenic land use estimates for the Holocene – HYDE 3.2, Earth Syst. Sci. Data, 9, 927–953, https://doi.org/10.5194/essd-9-927-2017, 2017.
Area Codes
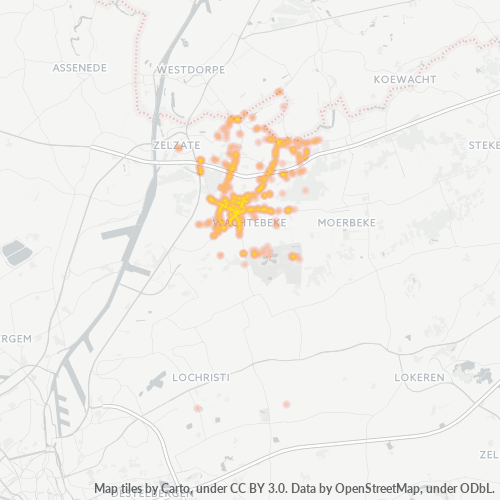
Percentage Area Codes used by businesses in Postal Code 9185 - Belgium
Business Concentration in Postal Code 9185 - Belgium
Industries
Business Distribution by Industry in Postal Code 9185 - Belgium
| Industry Description | Number of Establishments | Average Age of Business |
|---|---|---|
| Beauty salons | 29 | — |
| Cafes | 7 | — |
| Construction of buildings | 16 | 16.7 years |
| Grocery stores and supermarkets | 14 | — |
| Restaurants | 30 | 18.1 years |
| Shopping | 6 | 19.2 years |
| Sports clubs | 8 | — |
| Unreachable | 2 | — |
| Businesses | 2,525 |
| Estimated total revenue | ~€89.5M |
| Median revenue per business | ~€67.6K |
| Estimated jobs | 1,746 |
| Estimated payroll | ~€55.4M |
| Industries | Businesses | Total revenue | Median | Jobs |
|---|---|---|---|---|
| Wholesale and retail trade; repair of motor vehicles and motorcycles | 222 | ~€26.9M | ~€108.4K | 343 |
| Human health and social work activities | 80 | ~€9.9M | ~€58.1K | 228 |
| Arts, entertainment and recreation | 123 | ~€8.9M | ~€59.3K | 152 |
| Construction | 102 | ~€5.1M | ~€129.9K | 92 |
| Professional, scientific and technical activities | 83 | ~€4.6M | ~€80.0K | 87 |
| Accommodation and food service activities | 130 | ~€4.6M | ~€61.4K | 128 |
| Other service activities | 141 | ~€4.4M | ~€42.4K | 151 |
| Administrative and support service activities | 38 | ~€3.9M | ~€72.4K | 77 |
Largest businesses by estimated revenue
- Texaco — Lochristi · ~€3.9M
- Provincie Oost-Vlaanderen — Lochristi · ~€3.6M
- Aldi — Lochristi · ~€2.9M
- Proxy Wachtebeke — Lochristi · ~€2.3M
- Plaats kayakken — Lochristi · ~€1.7M
median from the 621 of 2,525 businesses with estimates Estimate based on strong signals
Postal Code 9185 - Belgium — Revenue trend
Median business revenue by year
| Year | 2019 | 2020 | 2021 | 2022 | 2023 | 2024 |
|---|---|---|---|---|---|---|
| Median revenue per business | ~€46.2K | ~€45.0K | ~€53.1K | ~€62.3K | ~€67.6K | ~€67.0K |
Revenue modeled for the same 621 businesses across all years. Estimate based on strong signals
Business distribution by price for Postal Code 9185 - Belgium
Human Development Index (HDI)
Statistic composite index of life expectancy, education, and per capita income.
Source: [Link] Kummu, M., Taka, M. &Guillaume, J. Gridded global datasets for Gross Domestic Product and Human Development Index over 1990–2015. Sci Data 5, 180004 (2018) doi:10.1038/sdata.2018.4
Postal Code 9185 - Belgium Gross Domestic Product (GDP)
GDP per capita, PPP (constant 2017 international $)
| Data | 1990 | 1995 | 2000 | 2005 | 2010 | 2015 | 2020 | 2022 |
|---|---|---|---|---|---|---|---|---|
| GDP per capita | $33,107 | $35,179 | $39,941 | $42,918 | $44,349 | $46,577 | $46,102 | $51,311 |
| Total GDP | $195.9M | $211.3M | $242.5M | $270.6M | $291.8M | $319.5M | $330.6M | $371M |
Source: [Link] Kummu, M., Kosonen, M. & Masoumzadeh Sayyar, S. Downscaled gridded global dataset for gross domestic product (GDP) per capita PPP over 1990–2022. Sci Data 12, 178 (2025) doi:10.1038/s41597-025-04487-x
Postal Code 9185 CO2 Emissions
Carbon Dioxide (CO2) Emissions Per Capita in Tonnes Per Year
| Location | CO2 Emissions | CO2 Emissions Per Capita | CO2 Emissions Intensity |
|---|---|---|---|
| Postal Code 9185 | 67,646 tn | 8.7 tn | 1,950.4 tons/km² |
| Belgium | 92,691,347 tn | 8.22 tn | 3,022.7 tons/km² |
Sources: [Link] Moran, D., Kanemoto K; Jiborn, M., Wood, R., Többen, J., and Seto, K.C. (2018) Carbon footprints of 13,000 cities. Environmental Research Letters DOI: 10.1088/1748-9326/aac72a
Postal Code 9185 CO2 Emissions
| 2013 CO2 emissions (tonnes/year) | 67,646 tn |
| 2013 CO2 emissions (tonnes/year) per capita | 8.7 tn |
| 2013 CO2 emissions intensity (tonnes/km²/year) | 1,950.4 tons/km² |
Natural Hazards Risk
Relative risk out of 10
| Hazard | Risk Level |
|---|---|
| Flood | Medium (4) |
* Risk, particularly concerning flood or landslide, may not be for the entire area.
Recent Nearby Earthquakes
Magnitude 3.0 and greater
| Date▼ | Time↕ | Magnitude↕ | Distance↕ | Depth↕ | Location↕ | Link |
|---|---|---|---|---|---|---|
| 7/13/08 | 6:45 AM | 3.8 | 78.5 km | 4,000 m | Belgium | usgs.gov |
| 7/13/08 | 6:33 PM | 3.2 | 84.3 km | 4,000 m | Belgium | usgs.gov |
| 2/27/05 | 12:16 AM | 3.1 | 98 km | 4,000 m | France | usgs.gov |
| 7/2/01 | 9:06 AM | 3.1 | 82.3 km | 5,000 m | Belgium | usgs.gov |
| 6/19/95 | 6:54 PM | 4.3 | 77.4 km | 20,000 m | Belgium | usgs.gov |
| 7/20/94 | 11:01 AM | 3.5 | 98.9 km | 5,000 m | Belgium | usgs.gov |
| 7/20/94 | 11:01 AM | 3.1 | 89.3 km | 5,000 m | Belgium | usgs.gov |
| 3/31/87 | 10:43 PM | 3.1 | 92.8 km | 10,000 m | Belgium | usgs.gov |
| 3/22/87 | 1:05 PM | 3.3 | 90.4 km | 10,000 m | Belgium | usgs.gov |
| 8/8/83 | 6:32 PM | 3.4 | 95.3 km | 10,000 m | Belgium | usgs.gov |
Showing 1-10 of 12
Source: U.S. Geological Survey (USGS)
About Our Data
The data on this page is estimated using a number of publicly available tools and resources. It is provided without warranty, and could contain inaccuracies. Use at your own risk.