Postal Code A0E - Newfoundland and Labrador
Newfoundland and Labrador | Canada
| Area of Postal Code A0E | 6,109.4 km² |
| Population | 21,352 |
| Male Population | 10,591 (49.6%) |
| Female Population | 10,761 (50.4%) |
| Population change from 1975 to 2015 | -26.3% |
| Population change from 2000 to 2015 | -13.0% |
| Median Age | 47.4 years |
| Male Median Age | 47.1 years |
| Female Median Age | 47.7 years |
| Area Codes | 709 |
| Postal Code Extensions | A0E 1A0, A0E 1B0, A0E 1C0, A0E 1E0, A0E 1G0, A0E 1H0, A0E 1J0, A0E 1K0, A0E 1L0, A0E 1M0 More |
| Associated Cities | Grand Bank, Marystown, Burin, Newfoundland and Labrador, Clarenville |
| Neighborhoods | Burin Bay Arm, Creston, Creston North, Little Bay, Northwest Calgary |
| Timezone | Newfoundland Daylight Time |
| Coordinates | 47.36559198050738° / -54.938719867746904° |
| Related Postal Codes | A0A, A0B, A0C, A0G, A0H, A0J, A0K, A0L, A0M, A0N |
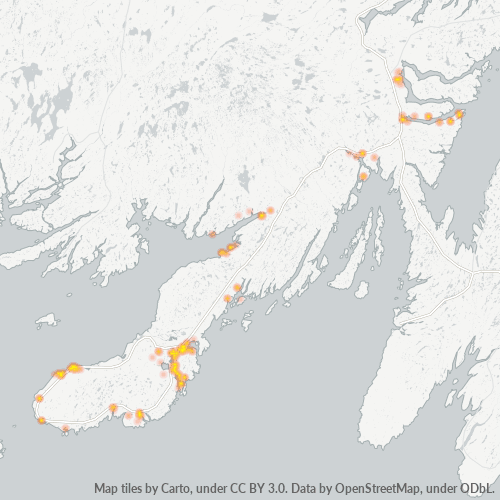
Map of Postal Code A0E - Newfoundland and Labrador
Interactive Map
Postal Code A0E - Newfoundland and Labrador Population
Years 1975 to 2020
| Data | 1975 | 1990 | 2000 | 2015 | 2020 |
|---|---|---|---|---|---|
| Population | 28,973 | 26,610 | 24,540 | 21,352 | 22,104 |
| Population Density | 4.7 / km² | 4.4 / km² | 4 / km² | 3.5 / km² | 3.6 / km² |
Sources: JRC (European Commission's Joint Research Centre) work on the GHS built-up grid
Postal Code A0E - Newfoundland and Labrador Population change from 2000 to 2015
Decrease of 13% from year 2000 to 2015
| Location | Change since 1975 | Change since 1990 | Change since 2000 |
|---|---|---|---|
| Postal Code A0E - Newfoundland and Labrador | -26.3% | -19.8% | -13% |
| Newfoundland and Labrador | +14.2% | +7.2% | +4.3% |
| Canada | +55.8% | +30.2% | +17.2% |
Sources: JRC (European Commission's Joint Research Centre) work on the GHS built-up grid
Postal Code A0E - Newfoundland and Labrador Median Age
Median Age: 47.4 years
| Location | Median Age | Median Age (Female) | Median Age (Male) |
|---|---|---|---|
| Postal Code A0E - Newfoundland and Labrador | 47.4 yrs | 47.7 yrs | 47.1 yrs |
| Newfoundland and Labrador | 44.5 yrs | 45 yrs | 44 yrs |
| Canada | 40.6 yrs | 41.5 yrs | 39.6 yrs |
Sources: CIESIN (Center for International Earth Science Information Network)
Postal Code A0E Population Density
Population Density: 3.5 / km²
| Location | Population | Area | Density |
|---|---|---|---|
| Postal Code A0E | 21,352 | 6,109.4 km² | 3.5 / km² |
| Newfoundland and Labrador | 532,251 | 438,810 km² | 1.2 / km² |
| Canada | 35.5 million | 9,875,295.4 km² | 3.6 / km² |
Sources: JRC (European Commission's Joint Research Centre) work on the GHS built-up grid
Postal Code A0E - Newfoundland and Labrador Historical and Projected Population
Estimated Population from 1720 to 2100
Sources:
- JRC (European Commission's Joint Research Centre) work on the GHS built-up grid
- CIESIN (Center for International Earth Science Information Network)
- [Link] Klein Goldewijk, K., Beusen, A., Doelman, J., and Stehfest, E.: Anthropogenic land use estimates for the Holocene – HYDE 3.2, Earth Syst. Sci. Data, 9, 927–953, https://doi.org/10.5194/essd-9-927-2017, 2017.
Neighborhoods
Business Distribution by neighborhood in Postal Code A0E - Newfoundland and Labrador
Business Concentration in Postal Code A0E - Newfoundland and Labrador
Industries
Business Distribution by Industry in Postal Code A0E - Newfoundland and Labrador
| Industry Description | Number of Establishments | Average Age of Business |
|---|---|---|
| Car repair | 28 | 28.4 years |
| Cemeteries and crematoriums | 18 | — |
| Clothing stores | 14 | 20.8 years |
| Education | 22 | 26.2 years |
| Finance other | 13 | 22.5 years |
| Financial services | 15 | 23.9 years |
| Gas station | 23 | 19.8 years |
| Hairdressers | 19 | 23.2 years |
| Museums | 14 | — |
| Other accommodation | 21 | 23.3 years |
| Other membership organizations | 23 | 23.9 years |
| Post office | 17 | 24 years |
| Public administration | 78 | 27.9 years |
| Public parks | 13 | — |
| Religion | 29 | 29.7 years |
| Restaurants | 54 | 23.1 years |
| Shopping | 37 | 22.3 years |
| Shopping other | 21 | 28 years |
Business distribution by price for Postal Code A0E - Newfoundland and Labrador
Human Development Index (HDI)
Statistic composite index of life expectancy, education, and per capita income.
Source: [Link] Kummu, M., Taka, M. &Guillaume, J. Gridded global datasets for Gross Domestic Product and Human Development Index over 1990–2015. Sci Data 5, 180004 (2018) doi:10.1038/sdata.2018.4
Postal Code A0E CO2 Emissions
Carbon Dioxide (CO2) Emissions Per Capita in Tonnes Per Year
| Location | CO2 Emissions | CO2 Emissions Per Capita | CO2 Emissions Intensity |
|---|---|---|---|
| Postal Code A0E | 278,608 tn | 13.05 tn | 45.6 tons/km² |
| Newfoundland and Labrador | 7,191,238 tn | 13.51 tn | 16.4 tons/km² |
| Canada | 521,999,336 tn | 14.7 tn | 52.9 tons/km² |
Sources: [Link] Moran, D., Kanemoto K; Jiborn, M., Wood, R., Többen, J., and Seto, K.C. (2018) Carbon footprints of 13,000 cities. Environmental Research Letters DOI: 10.1088/1748-9326/aac72a
Postal Code A0E CO2 Emissions
| 2013 CO2 emissions (tonnes/year) | 278,608 tn |
| 2013 CO2 emissions (tonnes/year) per capita | 13.05 tn |
| 2013 CO2 emissions intensity (tonnes/km²/year) | 45.6 tons/km² |
Natural Hazards Risk
Relative risk out of 10
| Hazard | Risk Level |
|---|---|
| Cyclone | High (9) |
* Risk, particularly concerning flood or landslide, may not be for the entire area.
Postal Code Extensions (42)
Cities
Percentage of businesses by city in Postal Code A0E - Newfoundland and Labrador
About Our Data
The data on this page is estimated using a number of publicly available tools and resources. It is provided without warranty, and could contain inaccuracies. Use at your own risk.