Postal Code E7M - Canada
Canada
| Area of Postal Code E7M | 443.3 km² |
| Population | 10,492 |
| Male Population | 4,976 (47.4%) |
| Female Population | 5,516 (52.6%) |
| Population change from 1975 to 2020 | +18.2% |
| Population change from 2000 to 2020 | +5.5% |
| Median Age | 43 years |
| Male Median Age | 40.7 years |
| Female Median Age | 45 years |
| Postal Code Extensions | E7M 0A1, E7M 0A2, E7M 0A3, E7M 0A4, E7M 0A5, E7M 0A6, E7M 0A7, E7M 0A8, E7M 0A9, E7M 0B1 More |
| Timezone | Bolivia Time |
| Coordinates | 46.152591329382275° / -67.58832922870734° |
| Related Postal Codes | E7A, E7B, E7C, E7E, E7G, E7H, E7J, E7K, E7L, E7N |
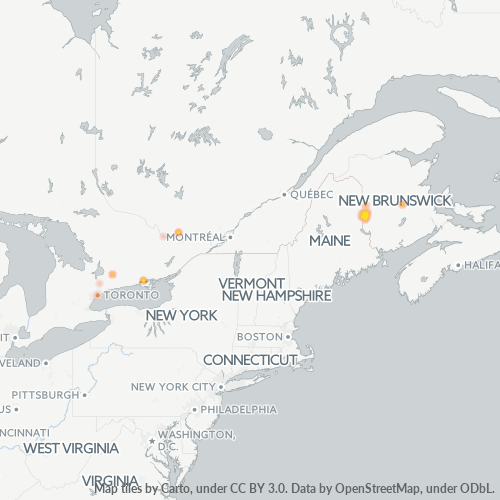
Map of Postal Code E7M - Canada
Interactive Map
Postal Code E7M - Canada Population
Years 1975 to 2030
| Data | 1975 | 1990 | 2000 | 2015 | 2020 | 2025* | 2030* |
|---|---|---|---|---|---|---|---|
| Population | 8,877 | 9,613 | 9,949 | 10,223 | 10,492 | 10,616 | 10,705 |
| Population Density | 20 / km² | 21.7 / km² | 22.4 / km² | 23.1 / km² | 23.7 / km² | 23.9 / km² | 24.1 / km² |
* Projected
Sources: JRC (European Commission's Joint Research Centre) work on the GHS built-up gridPostal Code E7M - Canada Population change from 2000 to 2020
Increase of 5.5% from year 2000 to 2020
| Location | Change since 1975 | Change since 1990 | Change since 2000 |
|---|---|---|---|
| Postal Code E7M - Canada | +18.2% | +9.1% | +5.5% |
| Canada | — | — | — |
Sources: JRC (European Commission's Joint Research Centre) work on the GHS built-up grid
Postal Code E7M - Canada Median Age
Median Age: 43 years
| Location | Median Age | Median Age (Female) | Median Age (Male) |
|---|---|---|---|
| Postal Code E7M - Canada | 43 yrs | 45 yrs | 40.7 yrs |
| Canada | 40.6 yrs | 41.5 yrs | 39.6 yrs |
Sources: CIESIN (Center for International Earth Science Information Network)
Postal Code E7M Population Density
Population Density: 23.7 / km²
| Location | Population | Area | Density |
|---|---|---|---|
| Postal Code E7M | 10,492 | 443.3 km² | 23.7 / km² |
| Canada | 35.5 million | 9,875,295.4 km² | 3.6 / km² |
Sources: JRC (European Commission's Joint Research Centre) work on the GHS built-up grid
Postal Code E7M - Canada Historical and Projected Population
Estimated Population from 1740 to 2100
Sources:
- JRC (European Commission's Joint Research Centre) work on the GHS built-up grid
- CIESIN (Center for International Earth Science Information Network)
- [Link] Klein Goldewijk, K., Beusen, A., Doelman, J., and Stehfest, E.: Anthropogenic land use estimates for the Holocene – HYDE 3.2, Earth Syst. Sci. Data, 9, 927–953, https://doi.org/10.5194/essd-9-927-2017, 2017.
Business Concentration in Postal Code E7M - Canada
Industries
Business Distribution by Industry in Postal Code E7M - Canada
| Industry Description | Number of Establishments | Average Age of Business |
|---|---|---|
| Accountants | 3 | 28.6 years |
| Banks | 11 | — |
| Beauty salons | 54 | 25.9 years |
| Car repair | 21 | 27.2 years |
| Construction of buildings | 14 | 27.9 years |
| Freight/commercial transport | 18 | 22 years |
| Furniture stores | 34 | — |
| General contractors | 10 | 23.1 years |
| Health and medical | 1 | 32 years |
| Lawyers legal | 1 | 28.2 years |
| Other construction | 2 | 27 years |
| Real estate | 1 | 25.5 years |
| Religion | 5 | 28 years |
| Restaurants | 61 | 22.1 years |
| Shopping | 3 | 25.3 years |
| Shopping other | 1 | 26.1 years |
Business distribution by price for Postal Code E7M - Canada
Human Development Index (HDI)
Statistic composite index of life expectancy, education, and per capita income.
Source: [Link] Kummu, M., Taka, M. &Guillaume, J. Gridded global datasets for Gross Domestic Product and Human Development Index over 1990–2015. Sci Data 5, 180004 (2018) doi:10.1038/sdata.2018.4
Postal Code E7M - Canada Gross Domestic Product (GDP)
GDP per capita, PPP (constant 2017 international $)
| Data | 1990 | 1995 | 2000 | 2005 | 2010 | 2015 | 2020 | 2022 |
|---|---|---|---|---|---|---|---|---|
| GDP per capita | $15,016 | $15,551 | $20,829 | $21,599 | $25,748 | $22,655 | $24,313 | $26,675 |
| Total GDP | $74.6M | $79.1M | $106.5M | $110.9M | $134M | $120.1M | $134M | $147.7M |
Source: [Link] Kummu, M., Kosonen, M. & Masoumzadeh Sayyar, S. Downscaled gridded global dataset for gross domestic product (GDP) per capita PPP over 1990–2022. Sci Data 12, 178 (2025) doi:10.1038/s41597-025-04487-x
Postal Code E7M CO2 Emissions
Carbon Dioxide (CO2) Emissions Per Capita in Tonnes Per Year
| Location | CO2 Emissions | CO2 Emissions Per Capita | CO2 Emissions Intensity |
|---|---|---|---|
| Postal Code E7M | 147,165 tn | 14.03 tn | 332 tons/km² |
| Canada | 521,999,336 tn | 14.7 tn | 52.9 tons/km² |
Sources: [Link] Moran, D., Kanemoto K; Jiborn, M., Wood, R., Többen, J., and Seto, K.C. (2018) Carbon footprints of 13,000 cities. Environmental Research Letters DOI: 10.1088/1748-9326/aac72a
Postal Code E7M CO2 Emissions
| 2013 CO2 emissions (tonnes/year) | 147,165 tn |
| 2013 CO2 emissions (tonnes/year) per capita | 14.03 tn |
| 2013 CO2 emissions intensity (tonnes/km²/year) | 332 tons/km² |
Natural Hazards Risk
Relative risk out of 10
| Hazard | Risk Level |
|---|---|
| Earthquake | Medium (3.7) |
* Risk, particularly concerning flood or landslide, may not be for the entire area.
Recent Nearby Earthquakes
Magnitude 3.0 and greater
| Date▼ | Time↕ | Magnitude↕ | Distance↕ | Depth↕ | Location↕ | Link |
|---|---|---|---|---|---|---|
| 2/8/16 | 4:24 PM | 3.3 | 63.6 km | 1,000 m | 44km SSW of Nackawic, Canada | usgs.gov |
| 8/27/15 | 3:47 PM | 3.6 | 77 km | 5,000 m | 29km N of Fredericton, Canada | usgs.gov |
| 11/1/14 | 6:58 PM | 3.2 | 97.2 km | 5,000 m | New Brunswick, Canada | usgs.gov |
| 6/1/06 | 2:34 AM | 3.6 | 48.9 km | 5,000 m | New Brunswick, Canada | usgs.gov |
| 10/18/03 | 9:25 AM | 3.5 | 92.7 km | 18,000 m | New Brunswick, Canada | usgs.gov |
Source: U.S. Geological Survey (USGS)
Postal Code Extensions (916)
About Our Data
The data on this page is estimated using a number of publicly available tools and resources. It is provided without warranty, and could contain inaccuracies. Use at your own risk.