Postal Code K0M - Ontario
Ontario | Canada
| Area of Postal Code K0M | 5,162.9 km² |
| Population | 48,020 |
| Male Population | 23,813 (49.6%) |
| Female Population | 24,207 (50.4%) |
| Population change from 1975 to 2015 | +2.7% |
| Population change from 2000 to 2015 | -0.7% |
| Median Age | 50.1 years |
| Male Median Age | 49.4 years |
| Female Median Age | 50.8 years |
| Area Codes | 705 |
| Postal Code Extensions | K0M 1A0, K0M 1B0, K0M 1C0, K0M 1E0, K0M 1G0, K0M 1J0, K0M 1J1, K0M 1J2, K0M 1K0, K0M 1L0 More |
| Associated Cities | Kawartha Lakes, Coboconk, Fenelon Falls, Kinmount |
| Neighborhoods | Bobcaygeon, Coboconk, Dunsford, Fenelon Falls, Norland, Woodville |
| Timezone | Eastern Daylight Time |
| Coordinates | 44.70249216685043° / -78.75041924331617° |
| Related Postal Codes | K0A, K0B, K0C, K0E, K0G, K0H, K0J, K0K, K0L, K1L |
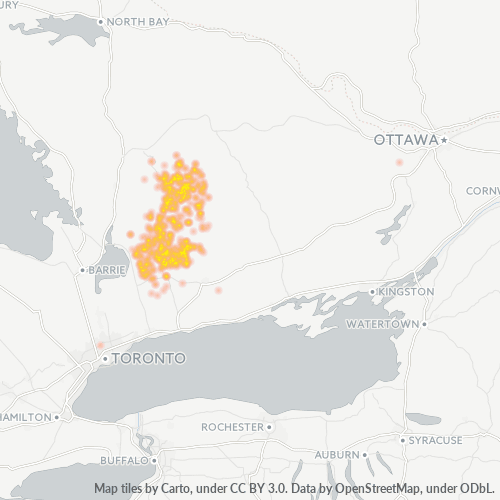
Map of Postal Code K0M - Ontario
Interactive Map
Postal Code K0M - Ontario Population
Years 1975 to 2020
| Data | 1975 | 1990 | 2000 | 2015 | 2020 |
|---|---|---|---|---|---|
| Population | 46,753 | 48,244 | 48,339 | 48,020 | 49,237 |
| Population Density | 9.1 / km² | 9.3 / km² | 9.4 / km² | 9.3 / km² | 9.5 / km² |
Sources: JRC (European Commission's Joint Research Centre) work on the GHS built-up grid
Postal Code K0M - Ontario Population change from 2000 to 2015
Decrease of 0.7% from year 2000 to 2015
| Location | Change since 1975 | Change since 1990 | Change since 2000 |
|---|---|---|---|
| Postal Code K0M - Ontario | +2.7% | -0.5% | -0.7% |
| Ontario | +52.6% | +28.6% | +16.4% |
| Canada | +55.8% | +30.2% | +17.2% |
Sources: JRC (European Commission's Joint Research Centre) work on the GHS built-up grid
Postal Code K0M - Ontario Median Age
Median Age: 50.1 years
| Location | Median Age | Median Age (Female) | Median Age (Male) |
|---|---|---|---|
| Postal Code K0M - Ontario | 50.1 yrs | 50.8 yrs | 49.4 yrs |
| Ontario | 40.5 yrs | 41.4 yrs | 39.6 yrs |
| Canada | 40.6 yrs | 41.5 yrs | 39.6 yrs |
Sources: CIESIN (Center for International Earth Science Information Network)
Postal Code K0M Population Density
Population Density: 9.3 / km²
| Location | Population | Area | Density |
|---|---|---|---|
| Postal Code K0M | 48,020 | 5,162.9 km² | 9.3 / km² |
| Ontario | 14.3 million | 1,078,182.8 km² | 13.3 / km² |
| Canada | 35.5 million | 9,875,295.4 km² | 3.6 / km² |
Sources: JRC (European Commission's Joint Research Centre) work on the GHS built-up grid
Postal Code K0M - Ontario Historical and Projected Population
Estimated Population from 1100 to 2100
Sources:
- JRC (European Commission's Joint Research Centre) work on the GHS built-up grid
- CIESIN (Center for International Earth Science Information Network)
- [Link] Klein Goldewijk, K., Beusen, A., Doelman, J., and Stehfest, E.: Anthropogenic land use estimates for the Holocene – HYDE 3.2, Earth Syst. Sci. Data, 9, 927–953, https://doi.org/10.5194/essd-9-927-2017, 2017.
Neighborhoods
Business Distribution by neighborhood in Postal Code K0M - Ontario
Business Concentration in Postal Code K0M - Ontario
Industries
Business Distribution by Industry in Postal Code K0M - Ontario
| Industry Description | Number of Establishments | Average Age of Business |
|---|---|---|
| Car repair | 106 | 23.2 years |
| Construction of buildings | 117 | 25.3 years |
| General contractors | 107 | 22.2 years |
| Other accommodation | 178 | 28.9 years |
| Public administration | 75 | 28.3 years |
| Public parks | 60 | 36.1 years |
| Real estate | 123 | 22.2 years |
| Religion | 60 | 36.7 years |
| Restaurants | 230 | 20.8 years |
| Shopping | 195 | 24.9 years |
| Shopping other | 98 | 22.5 years |
Business distribution by price for Postal Code K0M - Ontario
Human Development Index (HDI)
Statistic composite index of life expectancy, education, and per capita income.
Source: [Link] Kummu, M., Taka, M. &Guillaume, J. Gridded global datasets for Gross Domestic Product and Human Development Index over 1990–2015. Sci Data 5, 180004 (2018) doi:10.1038/sdata.2018.4
Postal Code K0M CO2 Emissions
Carbon Dioxide (CO2) Emissions Per Capita in Tonnes Per Year
| Location | CO2 Emissions | CO2 Emissions Per Capita | CO2 Emissions Intensity |
|---|---|---|---|
| Postal Code K0M | 694,998 tn | 14.47 tn | 134.6 tons/km² |
| Ontario | 206,082,698 tn | 14.38 tn | 191.1 tons/km² |
| Canada | 521,999,336 tn | 14.7 tn | 52.9 tons/km² |
Sources: [Link] Moran, D., Kanemoto K; Jiborn, M., Wood, R., Többen, J., and Seto, K.C. (2018) Carbon footprints of 13,000 cities. Environmental Research Letters DOI: 10.1088/1748-9326/aac72a
Postal Code K0M CO2 Emissions
| 2013 CO2 emissions (tonnes/year) | 694,998 tn |
| 2013 CO2 emissions (tonnes/year) per capita | 14.47 tn |
| 2013 CO2 emissions intensity (tonnes/km²/year) | 134.6 tons/km² |
Postal Code Extensions (26)
Cities
Percentage of businesses by city in Postal Code K0M - Ontario
About Our Data
The data on this page is estimated using a number of publicly available tools and resources. It is provided without warranty, and could contain inaccuracies. Use at your own risk.