Postal Code K2E - Ontario
Ontario | Canada
| Area of Postal Code K2E | 11 km² |
| Population | 20,445 |
| Male Population | 9,916 (48.5%) |
| Female Population | 10,529 (51.5%) |
| Population change from 1975 to 2015 | +102.0% |
| Population change from 2000 to 2015 | +27.0% |
| Median Age | 39.1 years |
| Male Median Age | 38.2 years |
| Female Median Age | 40 years |
| Area Codes | 613, 780 |
| Postal Code Extensions | K2E 0A1, K2E 0A2, K2E 0A3, K2E 0A4, K2E 0A5, K2E 0A6, K2E 0A7, K2E 0A8, K2E 0A9, K2E 0B1 More |
| Associated Cities | Ottawa, Richmond, Ontario |
| Neighborhoods | Industrial Park, Nepean |
| Timezone | Eastern Daylight Time |
| Coordinates | 45.35136874731284° / -75.71813843558321° |
| Related Postal Codes | K2A, K2B, K2C, K2J, K2K, K2L, K2M, K2P, K2R, K2S |
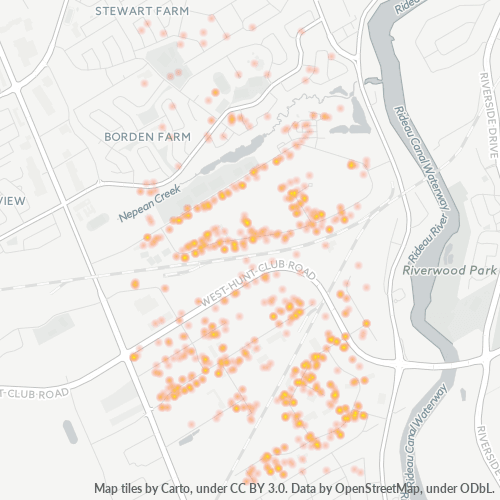
Map of Postal Code K2E - Ontario
Interactive Map
Postal Code K2E - Ontario Population
Years 1975 to 2020
| Data | 1975 | 1990 | 2000 | 2015 | 2020 |
|---|---|---|---|---|---|
| Population | 10,120 | 13,586 | 16,093 | 20,445 | 21,708 |
| Population Density | 918.9 / km² | 1,233.6 / km² | 1,461.3 / km² | 1,856.4 / km² | 1,971.1 / km² |
Sources: JRC (European Commission's Joint Research Centre) work on the GHS built-up grid
Postal Code K2E - Ontario Population change from 2000 to 2015
Increase of 27% from year 2000 to 2015
| Location | Change since 1975 | Change since 1990 | Change since 2000 |
|---|---|---|---|
| Postal Code K2E - Ontario | +102% | +50.5% | +27% |
| Ontario | +52.6% | +28.6% | +16.4% |
| Canada | +55.8% | +30.2% | +17.2% |
Sources: JRC (European Commission's Joint Research Centre) work on the GHS built-up grid
Postal Code K2E - Ontario Median Age
Median Age: 39.1 years
| Location | Median Age | Median Age (Female) | Median Age (Male) |
|---|---|---|---|
| Postal Code K2E - Ontario | 39.1 yrs | 40 yrs | 38.2 yrs |
| Ontario | 40.5 yrs | 41.4 yrs | 39.6 yrs |
| Canada | 40.6 yrs | 41.5 yrs | 39.6 yrs |
Sources: CIESIN (Center for International Earth Science Information Network)
Postal Code K2E Population Density
Population Density: 1,856 / km²
| Location | Population | Area | Density |
|---|---|---|---|
| Postal Code K2E | 20,445 | 11 km² | 1,856 / km² |
| Ontario | 14.3 million | 1,078,182.8 km² | 13.3 / km² |
| Canada | 35.5 million | 9,875,295.4 km² | 3.6 / km² |
Sources: JRC (European Commission's Joint Research Centre) work on the GHS built-up grid
Postal Code K2E - Ontario Historical and Projected Population
Estimated Population from 1850 to 2100
Sources:
- JRC (European Commission's Joint Research Centre) work on the GHS built-up grid
- CIESIN (Center for International Earth Science Information Network)
- [Link] Klein Goldewijk, K., Beusen, A., Doelman, J., and Stehfest, E.: Anthropogenic land use estimates for the Holocene – HYDE 3.2, Earth Syst. Sci. Data, 9, 927–953, https://doi.org/10.5194/essd-9-927-2017, 2017.
Business Concentration in Postal Code K2E - Ontario
Industries
Business Distribution by Industry in Postal Code K2E - Ontario
| Industry Description | Number of Establishments | Average Age of Business |
|---|---|---|
| Car repair | 47 | 24 years |
| Construction of buildings | 83 | 24.1 years |
| Corporate management | 106 | 21.5 years |
| Electronics stores | 112 | 22.7 years |
| Financial services | 43 | 13.5 years |
| General contractors | 51 | 27.9 years |
| Lawyers legal | 42 | 17.3 years |
| Real estate | 57 | 21.2 years |
| Restaurants | 68 | 17.4 years |
| Shopping | 77 | 22.6 years |
| Wholesale of construction supplies | 36 | 26.2 years |
| Wholesale of machinery | 59 | 25.1 years |
Business distribution by price for Postal Code K2E - Ontario
Human Development Index (HDI)
Statistic composite index of life expectancy, education, and per capita income.
Source: [Link] Kummu, M., Taka, M. &Guillaume, J. Gridded global datasets for Gross Domestic Product and Human Development Index over 1990–2015. Sci Data 5, 180004 (2018) doi:10.1038/sdata.2018.4
Postal Code K2E CO2 Emissions
Carbon Dioxide (CO2) Emissions Per Capita in Tonnes Per Year
| Location | CO2 Emissions | CO2 Emissions Per Capita | CO2 Emissions Intensity |
|---|---|---|---|
| Postal Code K2E | 349,602 tn | 17.1 tn | 31,744 tons/km² |
| Ontario | 206,082,698 tn | 14.38 tn | 191.1 tons/km² |
| Canada | 521,999,336 tn | 14.7 tn | 52.9 tons/km² |
Sources: [Link] Moran, D., Kanemoto K; Jiborn, M., Wood, R., Többen, J., and Seto, K.C. (2018) Carbon footprints of 13,000 cities. Environmental Research Letters DOI: 10.1088/1748-9326/aac72a
Postal Code K2E CO2 Emissions
| 2013 CO2 emissions (tonnes/year) | 349,602 tn |
| 2013 CO2 emissions (tonnes/year) per capita | 17.1 tn |
| 2013 CO2 emissions intensity (tonnes/km²/year) | 31,744 tons/km² |
Natural Hazards Risk
Relative risk out of 10
| Hazard | Risk Level |
|---|---|
| Earthquake | Medium (6) |
* Risk, particularly concerning flood or landslide, may not be for the entire area.
Recent Nearby Earthquakes
Magnitude 3.0 and greater
| Date▼ | Time↕ | Magnitude↕ | Distance↕ | Depth↕ | Location↕ | Link |
|---|---|---|---|---|---|---|
| 7/31/17 | 7:50 AM | 3.1 | 62.1 km | 21,500 m | 30km NNE of Val-des-Monts, Canada | usgs.gov |
| 11/27/15 | 9:16 PM | 3.2 | 88 km | 5,000 m | 4km S of Cornwall, Canada | usgs.gov |
| 9/9/15 | 12:17 PM | 3.2 | 69 km | 10,000 m | 20km NE of Shawville, Canada | usgs.gov |
| 7/15/15 | 3:00 PM | 3.3 | 93 km | 10,230 m | 13km SSE of Hawkesbury, Canada | usgs.gov |
| 6/30/13 | 1:40 AM | 3.1 | 66.3 km | 14,000 m | 19km NNE of Shawville, Canada | usgs.gov |
| 5/17/13 | 1:15 PM | 3.1 | 67.4 km | 18,000 m | 21km NNE of Shawville, Canada | usgs.gov |
| 5/17/13 | 6:53 AM | 3.6 | 67.1 km | 10,720 m | 18km NE of Shawville, Canada | usgs.gov |
| 5/17/13 | 6:43 AM | 5.1 | 67 km | 13,000 m | 19km NNE of Shawville, Canada | usgs.gov |
| 1/15/13 | 4:53 PM | 3.5 | 81.8 km | 18,000 m | southern Quebec, Canada | usgs.gov |
| 11/6/12 | 1:05 AM | 3.7 | 92.2 km | 11,070 m | Ontario-Quebec border region, Canada | usgs.gov |
Showing 1-10 of 41
…
Source: U.S. Geological Survey (USGS)
Postal Code Extensions (576)
About Our Data
The data on this page is estimated using a number of publicly available tools and resources. It is provided without warranty, and could contain inaccuracies. Use at your own risk.