Postal Code L0A - Ontario
| Area of Postal Code L0A | 666 km² |
| Population | 14,802 |
| Male Population | 7,295 (49.3%) |
| Female Population | 7,507 (50.7%) |
| Population change from 1975 to 2015 | +14.8% |
| Population change from 2000 to 2015 | +3.3% |
| Median Age | 45.7 years |
| Male Median Age | 45 years |
| Female Median Age | 46.3 years |
| Area Codes | 416, 519, 613, 705 |
| Postal Code Extensions | L0A 1A0, L0A 1B0, L0A 1C0, L0A 1E0, L0A 1G0, L0A 1J0, L0A 1K0 |
| Associated Cities | Bethany, Ontario, Cavan, Millbrook, Pontypool, Ontario |
| Neighborhoods | Bethany, Kendal, Pontypool |
| Timezone | Eastern Daylight Time |
| Coordinates | 44.10364834872039° / -78.51560118853585° |
| Related Postal Codes | L0B, L0C, L0E, L0G, L0H, L0J, L0K, L0L, L0M, L0N |
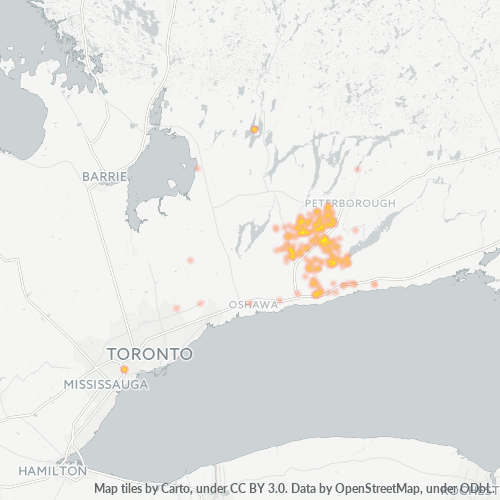
Map of Postal Code L0A - Ontario
Interactive Map
Postal Code L0A - Ontario Population
Years 1975 to 2020
| Data | 1975 | 1990 | 2000 | 2015 | 2020 |
|---|---|---|---|---|---|
| Population | 12,889 | 13,897 | 14,326 | 14,802 | 15,403 |
| Population Density | 19.4 / km² | 20.9 / km² | 21.5 / km² | 22.2 / km² | 23.1 / km² |
Postal Code L0A - Ontario Population change from 2000 to 2015
Increase of 3.3% from year 2000 to 2015
| Location | Change since 1975 | Change since 1990 | Change since 2000 |
|---|---|---|---|
| Postal Code L0A - Ontario | +14.8% | +6.5% | +3.3% |
| Ontario | +52.6% | +28.6% | +16.4% |
| Canada | +55.8% | +30.2% | +17.2% |
Postal Code L0A - Ontario Median Age
Median Age: 45.7 years
| Location | Median Age | Median Age (Female) | Median Age (Male) |
|---|---|---|---|
| Postal Code L0A - Ontario | 45.7 yrs | 46.3 yrs | 45 yrs |
| Ontario | 40.5 yrs | 41.4 yrs | 39.6 yrs |
| Canada | 40.6 yrs | 41.5 yrs | 39.6 yrs |
Postal Code L0A Population Density
Population Density: 22.2 / km²
| Location | Population | Area | Density |
|---|---|---|---|
| Postal Code L0A | 14,802 | 666 km² | 22.2 / km² |
| Ontario | 14.3 million | 1,078,182.8 km² | 13.3 / km² |
| Canada | 35.5 million | 9,875,295.4 km² | 3.6 / km² |
Postal Code L0A - Ontario Historical and Projected Population
Estimated Population from 1730 to 2100
- JRC (European Commission's Joint Research Centre) work on the GHS built-up grid
- CIESIN (Center for International Earth Science Information Network)
- [Link] Klein Goldewijk, K., Beusen, A., Doelman, J., and Stehfest, E.: Anthropogenic land use estimates for the Holocene – HYDE 3.2, Earth Syst. Sci. Data, 9, 927–953, https://doi.org/10.5194/essd-9-927-2017, 2017.
Neighborhoods
Business Distribution by neighborhood in Postal Code L0A - Ontario
Area Codes
Percentage Area Codes used by businesses in Postal Code L0A - Ontario
Industries
Business Distribution by Industry in Postal Code L0A - Ontario
| Industry Description | Number of Establishments | Average Age of Business |
|---|---|---|
| Car repair | 33 | 25.4 years |
| Construction of buildings | 37 | 22.7 years |
| Corporate management | 17 | 17.2 years |
| Electronics stores | 16 | 19.5 years |
| Gas station | 16 | 22.7 years |
| General contractors | 32 | 25.7 years |
| Landscaping | 20 | 18.9 years |
| Public administration | 29 | 27.4 years |
| Real estate | 26 | 18.8 years |
| Religion | 19 | 26.5 years |
| Restaurants | 32 | 19.7 years |
| Shopping | 42 | 22.8 years |
| Shopping other | 18 | 28 years |
| Tractors and farm equipment | 27 | 16.9 years |
Business distribution by price for Postal Code L0A - Ontario
Human Development Index (HDI)
Statistic composite index of life expectancy, education, and per capita income.
Postal Code L0A CO2 Emissions
Carbon Dioxide (CO2) Emissions Per Capita in Tonnes Per Year
| Location | CO2 Emissions | CO2 Emissions Per Capita | CO2 Emissions Intensity |
|---|---|---|---|
| Postal Code L0A | 221,791 tn | 14.98 tn | 333 tons/km² |
| Ontario | 206,082,698 tn | 14.38 tn | 191.1 tons/km² |
| Canada | 521,999,336 tn | 14.7 tn | 52.9 tons/km² |
| 2013 CO2 emissions (tonnes/year) | 221,791 tn |
| 2013 CO2 emissions (tonnes/year) per capita | 14.98 tn |
| 2013 CO2 emissions intensity (tonnes/km²/year) | 333 tons/km² |
Natural Hazards Risk
Relative risk out of 10
| Hazard | Risk Level |
|---|---|
| Earthquake | Low (2) |
Recent Nearby Earthquakes
Magnitude 3.0 and greater
| Date▼ | Time↕ | Magnitude↕ | Distance↕ | Depth↕ | Location↕ | Link |
|---|---|---|---|---|---|---|
| 5/24/00 | 3:22 AM | 3.1 | 57.3 km | 18,000 m | southern Ontario, Canada | usgs.gov |
| 11/26/99 | 2:33 PM | 3.8 | 58.4 km | 12,800 m | New York | usgs.gov |
| 12/25/98 | 5:30 AM | 3.6 | 56 km | 18,000 m | New York | usgs.gov |
Cities
Percentage of businesses by city in Postal Code L0A - Ontario
About Our Data
The data on this page is estimated using a number of publicly available tools and resources. It is provided without warranty, and could contain inaccuracies. Use at your own risk.