Postal Code M4N - Canada
| Area of Postal Code M4N | 4.894 km² |
| Population | 16,122 |
| Male Population | 7,741 (48.0%) |
| Female Population | 8,381 (52.0%) |
| Population change from 1975 to 2015 | +46.8% |
| Population change from 2000 to 2015 | +12.6% |
| Median Age | 39.2 years |
| Male Median Age | 38.2 years |
| Female Median Age | 40.2 years |
| Area Codes | 416, 780 |
| Postal Code Extensions | M4N 0A1, M4N 0A2, M4N 0A3, M4N 0A4, M4N 0A5, M4N 1A1, M4N 1A2, M4N 1A3, M4N 1A4, M4N 1A5 More |
| Associated Cities | Toronto, Hoggs Hollow, Lawrence Park, Yorkville |
| Neighborhoods | Bedford Park, North Toronto, North York, Old Toronto |
| Timezone | Eastern Daylight Time |
| Coordinates | 43.72667026768106° / -79.39513500080479° |
| Related Postal Codes | M4A, M4B, M4C, M4E, M4G, M4H, M4J, M4K, M4L, M4M |
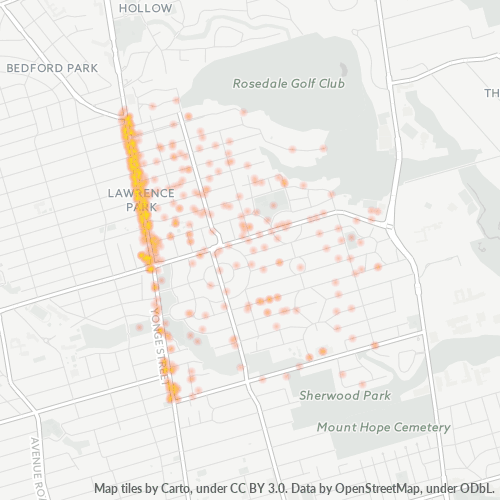
Map of Postal Code M4N - Canada
Interactive Map
Postal Code M4N - Canada Population
Years 1975 to 2020
| Data | 1975 | 1990 | 2000 | 2015 | 2020 |
|---|---|---|---|---|---|
| Population | 10,984 | 13,108 | 14,321 | 16,122 | 17,081 |
| Population Density | 2,244.5 / km² | 2,678.6 / km² | 2,926.4 / km² | 3,294.5 / km² | 3,490.4 / km² |
Postal Code M4N - Canada Population change from 2000 to 2015
Increase of 12.6% from year 2000 to 2015
| Location | Change since 1975 | Change since 1990 | Change since 2000 |
|---|---|---|---|
| Postal Code M4N - Canada | +46.8% | +23% | +12.6% |
| Canada | +55.8% | +30.2% | +17.2% |
Postal Code M4N - Canada Median Age
Median Age: 39.2 years
| Location | Median Age | Median Age (Female) | Median Age (Male) |
|---|---|---|---|
| Postal Code M4N - Canada | 39.2 yrs | 40.2 yrs | 38.2 yrs |
| Canada | 40.6 yrs | 41.5 yrs | 39.6 yrs |
Postal Code M4N Population Density
Population Density: 3,295 / km²
| Location | Population | Area | Density |
|---|---|---|---|
| Postal Code M4N | 16,122 | 4.894 km² | 3,295 / km² |
| Canada | 35.5 million | 9,875,295.4 km² | 3.6 / km² |
Postal Code M4N - Canada Historical and Projected Population
Estimated Population from 1850 to 2100
- JRC (European Commission's Joint Research Centre) work on the GHS built-up grid
- CIESIN (Center for International Earth Science Information Network)
- [Link] Klein Goldewijk, K., Beusen, A., Doelman, J., and Stehfest, E.: Anthropogenic land use estimates for the Holocene – HYDE 3.2, Earth Syst. Sci. Data, 9, 927–953, https://doi.org/10.5194/essd-9-927-2017, 2017.
Neighborhoods
Business Distribution by neighborhood in Postal Code M4N - Canada
Area Codes
Percentage Area Codes used by businesses in Postal Code M4N - Canada
Industries
Business Distribution by Industry in Postal Code M4N - Canada
| Industry Description | Number of Establishments | Average Age of Business |
|---|---|---|
| All membership organizations | 34 | 17.1 years |
| Beauty salons | 32 | 22.9 years |
| Construction of buildings | 37 | 23.5 years |
| Corporate management | 65 | 23.2 years |
| Dentists | 27 | 27.9 years |
| Education | 32 | 22.8 years |
| Electronics stores | 28 | 19.5 years |
| Hairdressers | 45 | 20.7 years |
| Health and medical | 78 | 23.9 years |
| Lawyers legal | 53 | 21 years |
| Physicians and surgeons | 53 | 22.4 years |
| Real estate | 50 | 22.8 years |
| Restaurants | 97 | 21.5 years |
| Shopping | 71 | 25.1 years |
Business distribution by price for Postal Code M4N - Canada
Human Development Index (HDI)
Statistic composite index of life expectancy, education, and per capita income.
Postal Code M4N CO2 Emissions
Carbon Dioxide (CO2) Emissions Per Capita in Tonnes Per Year
| Location | CO2 Emissions | CO2 Emissions Per Capita | CO2 Emissions Intensity |
|---|---|---|---|
| Postal Code M4N | 256,901 tn | 15.93 tn | 52,496.9 tons/km² |
| Canada | 521,999,336 tn | 14.7 tn | 52.9 tons/km² |
| 2013 CO2 emissions (tonnes/year) | 256,901 tn |
| 2013 CO2 emissions (tonnes/year) per capita | 15.93 tn |
| 2013 CO2 emissions intensity (tonnes/km²/year) | 52,496.9 tons/km² |
Natural Hazards Risk
Relative risk out of 10
| Hazard | Risk Level |
|---|---|
| Earthquake | Low (2) |
Recent Nearby Earthquakes
Magnitude 3.0 and greater
| Date▼ | Time↕ | Magnitude↕ | Distance↕ | Depth↕ | Location↕ | Link |
|---|---|---|---|---|---|---|
| 5/24/00 | 3:22 AM | 3.1 | 25.4 km | 18,000 m | southern Ontario, Canada | usgs.gov |
| 11/26/99 | 2:33 PM | 3.8 | 32.1 km | 12,800 m | New York | usgs.gov |
| 8/5/89 | 2:07 PM | 3.3 | 58.4 km | 18,000 m | southern Ontario, Canada | usgs.gov |
| 7/23/87 | 2:32 AM | 3.4 | 26.9 km | 6,800 m | southern Ontario, Canada | usgs.gov |
| 10/4/83 | 10:18 AM | 3.1 | 45.1 km | 2,000 m | southern Ontario, Canada | usgs.gov |
| 10/23/57 | 12:22 PM | 4.3 | 87 km | — | New York | usgs.gov |
Cities
Percentage of businesses by city in Postal Code M4N - Canada
About Our Data
The data on this page is estimated using a number of publicly available tools and resources. It is provided without warranty, and could contain inaccuracies. Use at your own risk.