Postal Code N0M - Ontario
Ontario | Canada
| Area of Postal Code N0M | 3,670.4 km² |
| Population | 67,083 |
| Male Population | 33,308 (49.7%) |
| Female Population | 33,775 (50.3%) |
| Population change from 1975 to 2015 | +12.4% |
| Population change from 2000 to 2015 | +2.4% |
| Median Age | 44.9 years |
| Male Median Age | 44.3 years |
| Female Median Age | 45.5 years |
| Area Codes | 519 |
| Postal Code Extensions | N0M 1A0, N0M 1B0, N0M 1C0, N0M 1E0, N0M 1G0, N0M 1H0, N0M 1J0, N0M 1K0, N0M 1L0, N0M 1M0 More |
| Associated Cities | Lambton Shores, South Huron, Bluewater, Ontario, Centralia |
| Neighborhoods | Arkona, Bayfield, Brucefield, Grand Bend, Port Franks, Thedford |
| Timezone | Eastern Daylight Time |
| Coordinates | 43.34423626708122° / -81.49121312276539° |
| Related Postal Codes | N0A, N0B, N0C, N0E, N0G, N0H, N0J, N0K, N0L, N0N |
Map of Postal Code N0M - Ontario
Interactive Map
Postal Code N0M - Ontario Population
Years 1975 to 2020
| Data | 1975 | 1990 | 2000 | 2015 | 2020 |
|---|---|---|---|---|---|
| Population | 59,670 | 63,954 | 65,488 | 67,083 | 69,783 |
| Population Density | 16.3 / km² | 17.4 / km² | 17.8 / km² | 18.3 / km² | 19 / km² |
Sources: JRC (European Commission's Joint Research Centre) work on the GHS built-up grid
Postal Code N0M - Ontario Population change from 2000 to 2015
Increase of 2.4% from year 2000 to 2015
| Location | Change since 1975 | Change since 1990 | Change since 2000 |
|---|---|---|---|
| Postal Code N0M - Ontario | +12.4% | +4.9% | +2.4% |
| Ontario | +52.6% | +28.6% | +16.4% |
| Canada | +55.8% | +30.2% | +17.2% |
Sources: JRC (European Commission's Joint Research Centre) work on the GHS built-up grid
Postal Code N0M - Ontario Median Age
Median Age: 44.9 years
| Location | Median Age | Median Age (Female) | Median Age (Male) |
|---|---|---|---|
| Postal Code N0M - Ontario | 44.9 yrs | 45.5 yrs | 44.3 yrs |
| Ontario | 40.5 yrs | 41.4 yrs | 39.6 yrs |
| Canada | 40.6 yrs | 41.5 yrs | 39.6 yrs |
Sources: CIESIN (Center for International Earth Science Information Network)
Postal Code N0M Population Density
Population Density: 18.3 / km²
| Location | Population | Area | Density |
|---|---|---|---|
| Postal Code N0M | 67,083 | 3,670.4 km² | 18.3 / km² |
| Ontario | 14.3 million | 1,078,182.8 km² | 13.3 / km² |
| Canada | 35.5 million | 9,875,295.4 km² | 3.6 / km² |
Sources: JRC (European Commission's Joint Research Centre) work on the GHS built-up grid
Postal Code N0M - Ontario Historical and Projected Population
Estimated Population from 1730 to 2100
Sources:
- JRC (European Commission's Joint Research Centre) work on the GHS built-up grid
- CIESIN (Center for International Earth Science Information Network)
- [Link] Klein Goldewijk, K., Beusen, A., Doelman, J., and Stehfest, E.: Anthropogenic land use estimates for the Holocene – HYDE 3.2, Earth Syst. Sci. Data, 9, 927–953, https://doi.org/10.5194/essd-9-927-2017, 2017.
Neighborhoods
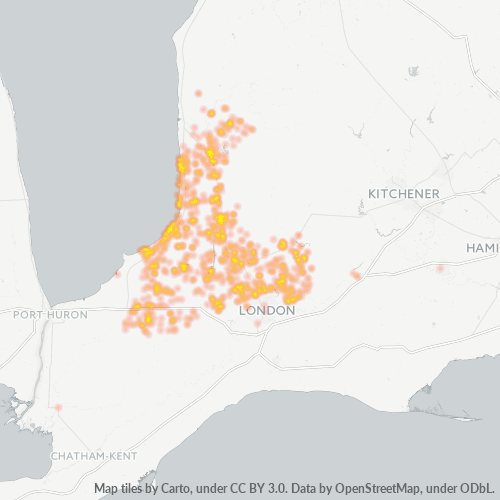
Business Distribution by neighborhood in Postal Code N0M - Ontario
Business Concentration in Postal Code N0M - Ontario
Industries
Business Distribution by Industry in Postal Code N0M - Ontario
| Industry Description | Number of Establishments | Average Age of Business |
|---|---|---|
| Car repair | 155 | 26.7 years |
| Construction of buildings | 143 | 25.9 years |
| General contractors | 112 | 24.8 years |
| Other accommodation | 119 | 27.6 years |
| Public administration | 146 | 30.3 years |
| Real estate | 122 | 24.4 years |
| Religion | 133 | 34 years |
| Restaurants | 271 | 21.4 years |
| Shopping | 288 | 24.6 years |
| Shopping other | 113 | 24.3 years |
| Tractors and farm equipment | 168 | 27.7 years |
| Wholesale of construction supplies | 84 | 24.7 years |
Business distribution by price for Postal Code N0M - Ontario
Human Development Index (HDI)
Statistic composite index of life expectancy, education, and per capita income.
Source: [Link] Kummu, M., Taka, M. &Guillaume, J. Gridded global datasets for Gross Domestic Product and Human Development Index over 1990–2015. Sci Data 5, 180004 (2018) doi:10.1038/sdata.2018.4
Postal Code N0M CO2 Emissions
Carbon Dioxide (CO2) Emissions Per Capita in Tonnes Per Year
| Location | CO2 Emissions | CO2 Emissions Per Capita | CO2 Emissions Intensity |
|---|---|---|---|
| Postal Code N0M | 1,008,818 tn | 15.04 tn | 274.9 tons/km² |
| Ontario | 206,082,698 tn | 14.38 tn | 191.1 tons/km² |
| Canada | 521,999,336 tn | 14.7 tn | 52.9 tons/km² |
Sources: [Link] Moran, D., Kanemoto K; Jiborn, M., Wood, R., Többen, J., and Seto, K.C. (2018) Carbon footprints of 13,000 cities. Environmental Research Letters DOI: 10.1088/1748-9326/aac72a
Postal Code N0M CO2 Emissions
| 2013 CO2 emissions (tonnes/year) | 1,008,818 tn |
| 2013 CO2 emissions (tonnes/year) per capita | 15.04 tn |
| 2013 CO2 emissions intensity (tonnes/km²/year) | 274.9 tons/km² |
Natural Hazards Risk
Relative risk out of 10
| Hazard | Risk Level |
|---|---|
| Flood | Medium (7) |
* Risk, particularly concerning flood or landslide, may not be for the entire area.
Recent Nearby Earthquakes
Magnitude 3.0 and greater
| Date▼ | Time↕ | Magnitude↕ | Distance↕ | Depth↕ | Location↕ | Link |
|---|---|---|---|---|---|---|
| 9/4/81 | 10:49 PM | 3.1 | 69.2 km | 4,000 m | southern Ontario, Canada | usgs.gov |
| 8/28/81 | 3:51 AM | 3.3 | 76.3 km | 18,000 m | southern Ontario, Canada | usgs.gov |
Source: U.S. Geological Survey (USGS)
Postal Code Extensions (41)
Cities
Percentage of businesses by city in Postal Code N0M - Ontario
About Our Data
The data on this page is estimated using a number of publicly available tools and resources. It is provided without warranty, and could contain inaccuracies. Use at your own risk.