Postal Code P0L - Ontario
Ontario | Canada
| Area of Postal Code P0L | 131,866.4 km² |
| Population | 26,088 |
| Male Population | 13,080 (50.1%) |
| Female Population | 13,008 (49.9%) |
| Population change from 1975 to 2020 | -9.4% |
| Population change from 2000 to 2020 | -0.5% |
| Median Age | 40.1 years |
| Male Median Age | 40.3 years |
| Female Median Age | 39.9 years |
| Area Codes | 416, 519, 613, 705 |
| Postal Code Extensions | P0L 1A0, P0L 1B0, P0L 1C0, P0L 1E0, P0L 1G0, P0L 1H0, P0L 1K0, P0L 1L0, P0L 1M0, P0L 1N0 More |
| Associated Cities | Hearst, Ontario, Fort Albany, Fauquier-Strickland, Cochrane, Ontario |
| Timezone | Eastern Daylight Time |
| Coordinates | 49.72153564223955° / -82.57644207566744° |
| Related Postal Codes | P0A, P0B, P0C, P0E, P0G, P0H, P0J, P0K, P0X, P0Y |
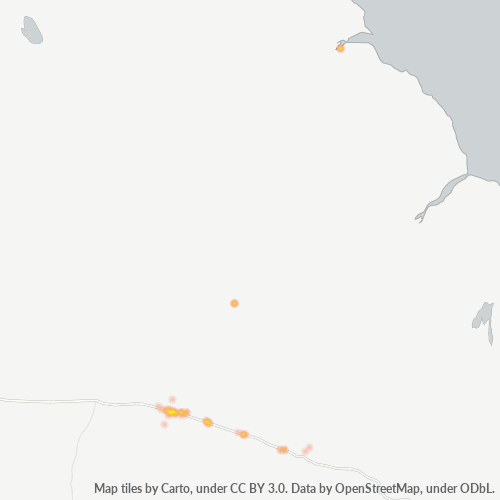
Map of Postal Code P0L - Ontario
Interactive Map
Postal Code P0L - Ontario Population
Years 1975 to 2030
| Data | 1975 | 1990 | 2000 | 2015 | 2020 | 2025* | 2030* |
|---|---|---|---|---|---|---|---|
| Population | 28,779 | 27,569 | 26,218 | 24,026 | 26,088 | 27,032 | 27,851 |
| Population Density | 0.2 / km² | 0.2 / km² | 0.2 / km² | 0.2 / km² | 0.2 / km² | 0.2 / km² | 0.2 / km² |
* Projected
Sources: JRC (European Commission's Joint Research Centre) work on the GHS built-up gridPostal Code P0L - Ontario Population change from 2000 to 2020
Decrease of 0.5% from year 2000 to 2020
| Location | Change since 1975 | Change since 1990 | Change since 2000 |
|---|---|---|---|
| Postal Code P0L - Ontario | -9.4% | -5.4% | -0.5% |
| Ontario | +58.9% | +33.9% | +21.2% |
| Canada | — | — | — |
Sources: JRC (European Commission's Joint Research Centre) work on the GHS built-up grid
Postal Code P0L - Ontario Median Age
Median Age: 40.1 years
| Location | Median Age | Median Age (Female) | Median Age (Male) |
|---|---|---|---|
| Postal Code P0L - Ontario | 40.1 yrs | 39.9 yrs | 40.3 yrs |
| Ontario | 40.5 yrs | 41.4 yrs | 39.6 yrs |
| Canada | 40.6 yrs | 41.5 yrs | 39.6 yrs |
Sources: CIESIN (Center for International Earth Science Information Network)
Postal Code P0L Population Density
Population Density: 0.2 / km²
| Location | Population | Area | Density |
|---|---|---|---|
| Postal Code P0L | 26,088 | 131,866.4 km² | 0.2 / km² |
| Ontario | 14.3 million | 1,078,182.8 km² | 13.3 / km² |
| Canada | 35.5 million | 9,875,295.4 km² | 3.6 / km² |
Sources: JRC (European Commission's Joint Research Centre) work on the GHS built-up grid
Postal Code P0L - Ontario Historical and Projected Population
Estimated Population from 700 to 2100
Sources:
- JRC (European Commission's Joint Research Centre) work on the GHS built-up grid
- CIESIN (Center for International Earth Science Information Network)
- [Link] Klein Goldewijk, K., Beusen, A., Doelman, J., and Stehfest, E.: Anthropogenic land use estimates for the Holocene – HYDE 3.2, Earth Syst. Sci. Data, 9, 927–953, https://doi.org/10.5194/essd-9-927-2017, 2017.
Business Concentration in Postal Code P0L - Ontario
Industries
Business Distribution by Industry in Postal Code P0L - Ontario
| Industry Description | Number of Establishments | Average Age of Business |
|---|---|---|
| Beauty salons | 30 | 16.8 years |
| Car repair | 39 | 25.6 years |
| Construction of buildings | 28 | 26 years |
| Education | 68 | 28 years |
| Financial services | 28 | 28 years |
| Gas station | 32 | 25.2 years |
| Hairdressers | 34 | 24.7 years |
| Health and medical | 25 | 27 years |
| Lawyers legal | 24 | 21.6 years |
| Public administration | 188 | 29.2 years |
| Religion | 46 | 25.7 years |
| Restaurants | 88 | 20.5 years |
| Senior care | 35 | 22.7 years |
| Shopping | 61 | 23.5 years |
| Social work | 57 | 21.3 years |
Business distribution by price for Postal Code P0L - Ontario
Human Development Index (HDI)
Statistic composite index of life expectancy, education, and per capita income.
Source: [Link] Kummu, M., Taka, M. &Guillaume, J. Gridded global datasets for Gross Domestic Product and Human Development Index over 1990–2015. Sci Data 5, 180004 (2018) doi:10.1038/sdata.2018.4
Postal Code P0L - Ontario Gross Domestic Product (GDP)
GDP per capita, PPP (constant 2017 international $)
| Data | 1990 | 1995 | 2000 | 2005 | 2010 | 2015 | 2020 | 2022 |
|---|---|---|---|---|---|---|---|---|
| GDP per capita | $32,619 | $35,938 | $43,494 | $44,221 | $34,998 | $29,683 | $26,435 | $30,977 |
| Total GDP | $784.7M | $892.1M | $1.1B | $1.1B | $847.7M | $721.7M | $679.6M | $800.4M |
Source: [Link] Kummu, M., Kosonen, M. & Masoumzadeh Sayyar, S. Downscaled gridded global dataset for gross domestic product (GDP) per capita PPP over 1990–2022. Sci Data 12, 178 (2025) doi:10.1038/s41597-025-04487-x
Postal Code P0L CO2 Emissions
Carbon Dioxide (CO2) Emissions Per Capita in Tonnes Per Year
| Location | CO2 Emissions | CO2 Emissions Per Capita | CO2 Emissions Intensity |
|---|---|---|---|
| Postal Code P0L | 386,662 tn | 14.82 tn | 2.9 tons/km² |
| Ontario | 206,082,698 tn | 14.38 tn | 191.1 tons/km² |
| Canada | 521,999,336 tn | 14.7 tn | 52.9 tons/km² |
Sources: [Link] Moran, D., Kanemoto K; Jiborn, M., Wood, R., Többen, J., and Seto, K.C. (2018) Carbon footprints of 13,000 cities. Environmental Research Letters DOI: 10.1088/1748-9326/aac72a
Postal Code P0L CO2 Emissions
| 2013 CO2 emissions (tonnes/year) | 386,662 tn |
| 2013 CO2 emissions (tonnes/year) per capita | 14.82 tn |
| 2013 CO2 emissions intensity (tonnes/km²/year) | 2.9 tons/km² |
Natural Hazards Risk
Relative risk out of 10
| Hazard | Risk Level |
|---|---|
| Drought | Medium (4) |
* Risk, particularly concerning flood or landslide, may not be for the entire area.
Recent Nearby Earthquakes
Magnitude 3.0 and greater
| Date▼ | Time↕ | Magnitude↕ | Distance↕ | Depth↕ | Location↕ | Link |
|---|---|---|---|---|---|---|
| 12/6/06 | 8:44 PM | 4.2 | 78.5 km | 16,000 m | Ontario, Canada | usgs.gov |
| 3/3/06 | 6:13 PM | 3.4 | 75.8 km | 18,000 m | Ontario, Canada | usgs.gov |
| 8/15/96 | 9:56 PM | 3.5 | 62.1 km | 18,000 m | Ontario, Canada | usgs.gov |
| 4/13/80 | 2:40 PM | 4.1 | 80.6 km | 18,000 m | Ontario, Canada | usgs.gov |
Source: U.S. Geological Survey (USGS)
Postal Code Extensions (23)
Cities
Percentage of businesses by city in Postal Code P0L - Ontario
About Our Data
The data on this page is estimated using a number of publicly available tools and resources. It is provided without warranty, and could contain inaccuracies. Use at your own risk.