Postal Code R0E - Manitoba
Manitoba | Canada
| Area of Postal Code R0E | 48,509.9 km² |
| Population | 50,477 |
| Male Population | 25,539 (50.6%) |
| Female Population | 24,938 (49.4%) |
| Population change from 1975 to 2020 | +64.7% |
| Population change from 2000 to 2020 | +26.6% |
| Median Age | 44.7 years |
| Male Median Age | 44.6 years |
| Female Median Age | 44.8 years |
| Area Codes | 204, 780 |
| Postal Code Extensions | R0E 0A0, R0E 0B0, R0E 0C0, R0E 0E0, R0E 0J0, R0E 0K0, R0E 0L0, R0E 0M0, R0E 0N0, R0E 0P0 More |
| Associated Cities | Selkirk, Manitoba, Beausejour, Manitoba, Lac du Bonnet, Manitoba, Elma, Manitoba |
| Neighborhoods | Pine Falls, Powerview |
| Timezone | Central Daylight Time |
| Coordinates | 50.2512533219086° / -96.34944171470575° |
| Related Postal Codes | R0A, R0B, R0C, R0G, R0H, R0J, R0K, R0L, R0M, R1A |
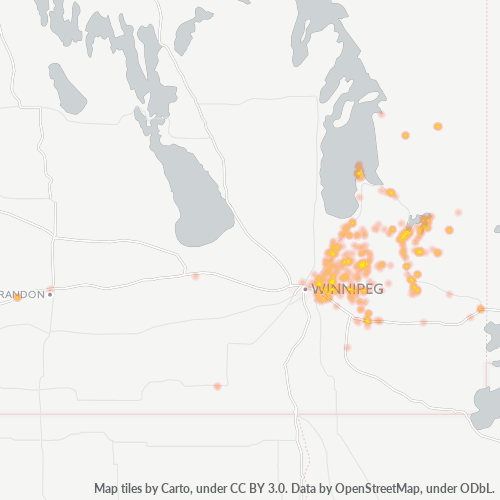
Map of Postal Code R0E - Manitoba
Interactive Map
Postal Code R0E - Manitoba Population
Years 1975 to 2030
| Data | 1975 | 1990 | 2000 | 2015 | 2020 | 2025* | 2030* |
|---|---|---|---|---|---|---|---|
| Population | 30,650 | 36,108 | 39,883 | 46,514 | 50,477 | 52,187 | 53,693 |
| Population Density | 0.6 / km² | 0.7 / km² | 0.8 / km² | 1 / km² | 1 / km² | 1.1 / km² | 1.1 / km² |
* Projected
Sources: JRC (European Commission's Joint Research Centre) work on the GHS built-up gridPostal Code R0E - Manitoba Population change from 2000 to 2020
Increase of 26.6% from year 2000 to 2020
| Location | Change since 1975 | Change since 1990 | Change since 2000 |
|---|---|---|---|
| Postal Code R0E - Manitoba | +64.7% | +39.8% | +26.6% |
| Manitoba | +59.8% | +34.8% | +22.5% |
| Canada | — | — | — |
Sources: JRC (European Commission's Joint Research Centre) work on the GHS built-up grid
Postal Code R0E - Manitoba Median Age
Median Age: 44.7 years
| Location | Median Age | Median Age (Female) | Median Age (Male) |
|---|---|---|---|
| Postal Code R0E - Manitoba | 44.7 yrs | 44.8 yrs | 44.6 yrs |
| Manitoba | 38.2 yrs | 39.3 yrs | 37.1 yrs |
| Canada | 40.6 yrs | 41.5 yrs | 39.6 yrs |
Sources: CIESIN (Center for International Earth Science Information Network)
Postal Code R0E Population Density
Population Density: 1 / km²
| Location | Population | Area | Density |
|---|---|---|---|
| Postal Code R0E | 50,477 | 48,509.9 km² | 1 / km² |
| Manitoba | 1.4 million | 649,857.2 km² | 2.1 / km² |
| Canada | 35.5 million | 9,875,295.4 km² | 3.6 / km² |
Sources: JRC (European Commission's Joint Research Centre) work on the GHS built-up grid
Postal Code R0E - Manitoba Historical and Projected Population
Estimated Population from 1880 to 2100
Sources:
- JRC (European Commission's Joint Research Centre) work on the GHS built-up grid
- CIESIN (Center for International Earth Science Information Network)
- [Link] Klein Goldewijk, K., Beusen, A., Doelman, J., and Stehfest, E.: Anthropogenic land use estimates for the Holocene – HYDE 3.2, Earth Syst. Sci. Data, 9, 927–953, https://doi.org/10.5194/essd-9-927-2017, 2017.
Neighborhoods
Business Distribution by neighborhood in Postal Code R0E - Manitoba
Business Concentration in Postal Code R0E - Manitoba
Industries
Business Distribution by Industry in Postal Code R0E - Manitoba
| Industry Description | Number of Establishments | Average Age of Business |
|---|---|---|
| Accountants | 38 | 23.1 years |
| Campgrounds | 35 | 27.4 years |
| Car repair | 58 | 24.5 years |
| Construction of buildings | 39 | 25.7 years |
| Education | 60 | 23.4 years |
| Gas station | 48 | 27.4 years |
| General contractors | 46 | 21.9 years |
| Other accommodation | 72 | 28.1 years |
| Other membership organizations | 39 | 26.9 years |
| Public administration | 147 | 26.7 years |
| Real estate | 45 | 22.1 years |
| Religion | 62 | 29.1 years |
| Restaurants | 117 | 20.9 years |
| Shopping | 83 | 23.5 years |
| Wholesale of construction supplies | 45 | 23.4 years |
Business distribution by price for Postal Code R0E - Manitoba
Human Development Index (HDI)
Statistic composite index of life expectancy, education, and per capita income.
Source: [Link] Kummu, M., Taka, M. &Guillaume, J. Gridded global datasets for Gross Domestic Product and Human Development Index over 1990–2015. Sci Data 5, 180004 (2018) doi:10.1038/sdata.2018.4
Postal Code R0E - Manitoba Gross Domestic Product (GDP)
GDP per capita, PPP (constant 2017 international $)
| Data | 1990 | 1995 | 2000 | 2005 | 2010 | 2015 | 2020 | 2022 |
|---|---|---|---|---|---|---|---|---|
| GDP per capita | $17,708 | $17,164 | $22,006 | $23,865 | $28,658 | $33,329 | $30,754 | $33,551 |
| Total GDP | $800.6M | $848.9M | $1.2B | $1.3B | $1.7B | $1.9B | $1.9B | $2.1B |
Source: [Link] Kummu, M., Kosonen, M. & Masoumzadeh Sayyar, S. Downscaled gridded global dataset for gross domestic product (GDP) per capita PPP over 1990–2022. Sci Data 12, 178 (2025) doi:10.1038/s41597-025-04487-x
Postal Code R0E CO2 Emissions
Carbon Dioxide (CO2) Emissions Per Capita in Tonnes Per Year
| Location | CO2 Emissions | CO2 Emissions Per Capita | CO2 Emissions Intensity |
|---|---|---|---|
| Postal Code R0E | 602,913 tn | 11.94 tn | 12.4 tons/km² |
| Manitoba | 17,561,907 tn | 12.78 tn | 27 tons/km² |
| Canada | 521,999,336 tn | 14.7 tn | 52.9 tons/km² |
Sources: [Link] Moran, D., Kanemoto K; Jiborn, M., Wood, R., Többen, J., and Seto, K.C. (2018) Carbon footprints of 13,000 cities. Environmental Research Letters DOI: 10.1088/1748-9326/aac72a
Postal Code R0E CO2 Emissions
| 2013 CO2 emissions (tonnes/year) | 602,913 tn |
| 2013 CO2 emissions (tonnes/year) per capita | 11.94 tn |
| 2013 CO2 emissions intensity (tonnes/km²/year) | 12.4 tons/km² |
Natural Hazards Risk
Relative risk out of 10
| Hazard | Risk Level |
|---|---|
| Drought | Medium (4.3) |
| Flood | Medium (7) |
* Risk, particularly concerning flood or landslide, may not be for the entire area.
Postal Code Extensions (42)
Cities
Percentage of businesses by city in Postal Code R0E - Manitoba
About Our Data
The data on this page is estimated using a number of publicly available tools and resources. It is provided without warranty, and could contain inaccuracies. Use at your own risk.