Postal Code T0B - Alberta
Alberta | Canada
| Area of Postal Code T0B | 32,460.8 km² |
| Population | 78,198 |
| Male Population | 39,951 (51.1%) |
| Female Population | 38,247 (48.9%) |
| Population change from 1975 to 2020 | +73.2% |
| Population change from 2000 to 2020 | +30.9% |
| Median Age | 42 years |
| Male Median Age | 41.9 years |
| Female Median Age | 42.1 years |
| Area Codes | 403, 780 |
| Postal Code Extensions | T0B 0A0, T0B 0B0, T0B 0C0, T0B 0G0, T0B 0H0, T0B 0J0, T0B 0K0, T0B 0L0, T0B 0M0, T0B 0P0 More |
| Associated Cities | Wainwright, Alberta, Provost, Alberta, Tofield, Lamont, Alberta |
| Timezone | Mountain Daylight Time |
| Coordinates | 53.087314846072815° / -111.79125871084423° |
| Related Postal Codes | T0A, T0E, T0G, T0H, T0J, T0K, T0L, T0M, T0P, T0V |
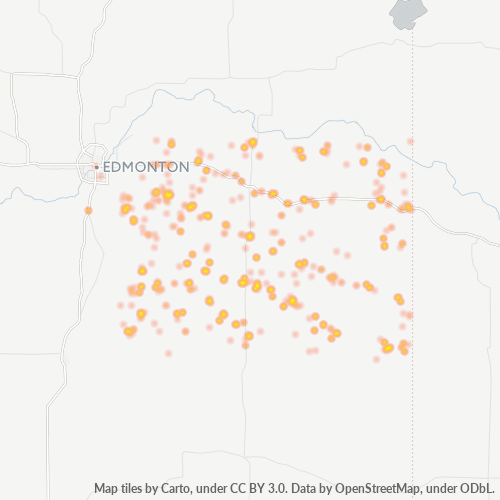
Map of Postal Code T0B - Alberta
Interactive Map
Postal Code T0B - Alberta Population
Years 1975 to 2030
| Data | 1975 | 1990 | 2000 | 2015 | 2020 | 2025* | 2030* |
|---|---|---|---|---|---|---|---|
| Population | 45,158 | 53,792 | 59,719 | 68,964 | 78,198 | 84,444 | 90,455 |
| Population Density | 1.4 / km² | 1.7 / km² | 1.8 / km² | 2.1 / km² | 2.4 / km² | 2.6 / km² | 2.8 / km² |
* Projected
Sources: JRC (European Commission's Joint Research Centre) work on the GHS built-up gridPostal Code T0B - Alberta Population change from 2000 to 2020
Increase of 30.9% from year 2000 to 2020
| Location | Change since 1975 | Change since 1990 | Change since 2000 |
|---|---|---|---|
| Postal Code T0B - Alberta | +73.2% | +45.4% | +30.9% |
| Alberta | +158.8% | +86.6% | +52.8% |
| Canada | — | — | — |
Sources: JRC (European Commission's Joint Research Centre) work on the GHS built-up grid
Postal Code T0B - Alberta Median Age
Median Age: 42 years
| Location | Median Age | Median Age (Female) | Median Age (Male) |
|---|---|---|---|
| Postal Code T0B - Alberta | 42 yrs | 42.1 yrs | 41.9 yrs |
| Alberta | 36.5 yrs | 37.1 yrs | 35.9 yrs |
| Canada | 40.6 yrs | 41.5 yrs | 39.6 yrs |
Sources: CIESIN (Center for International Earth Science Information Network)
Postal Code T0B Population Density
Population Density: 2.4 / km²
| Location | Population | Area | Density |
|---|---|---|---|
| Postal Code T0B | 78,198 | 32,460.8 km² | 2.4 / km² |
| Alberta | 4.6 million | 663,102.6 km² | 7 / km² |
| Canada | 35.5 million | 9,875,295.4 km² | 3.6 / km² |
Sources: JRC (European Commission's Joint Research Centre) work on the GHS built-up grid
Postal Code T0B - Alberta Historical and Projected Population
Estimated Population from 1820 to 2100
Sources:
- JRC (European Commission's Joint Research Centre) work on the GHS built-up grid
- CIESIN (Center for International Earth Science Information Network)
- [Link] Klein Goldewijk, K., Beusen, A., Doelman, J., and Stehfest, E.: Anthropogenic land use estimates for the Holocene – HYDE 3.2, Earth Syst. Sci. Data, 9, 927–953, https://doi.org/10.5194/essd-9-927-2017, 2017.
Business Concentration in Postal Code T0B - Alberta
Industries
Business Distribution by Industry in Postal Code T0B - Alberta
| Industry Description | Number of Establishments | Average Age of Business |
|---|---|---|
| Car repair | 144 | 22.9 years |
| Construction of buildings | 91 | 23.1 years |
| Education | 113 | 28.4 years |
| Finance other | 66 | 26.8 years |
| Gas station | 154 | 26.6 years |
| General contractors | 80 | 25.4 years |
| Hairdressers | 69 | 19.1 years |
| Mining | 73 | 22.4 years |
| Other accommodation | 96 | 25.4 years |
| Other membership organizations | 70 | 24.9 years |
| Post office | 106 | 22.3 years |
| Public administration | 149 | 28.7 years |
| Religion | 142 | 28 years |
| Restaurants | 193 | 21.5 years |
| Shopping | 134 | 23.9 years |
| Shopping other | 152 | 23.1 years |
| Tractors and farm equipment | 115 | 23.8 years |
Business distribution by price for Postal Code T0B - Alberta
Human Development Index (HDI)
Statistic composite index of life expectancy, education, and per capita income.
Source: [Link] Kummu, M., Taka, M. &Guillaume, J. Gridded global datasets for Gross Domestic Product and Human Development Index over 1990–2015. Sci Data 5, 180004 (2018) doi:10.1038/sdata.2018.4
Postal Code T0B - Alberta Gross Domestic Product (GDP)
GDP per capita, PPP (constant 2017 international $)
| Data | 1990 | 1995 | 2000 | 2005 | 2010 | 2015 | 2020 | 2022 |
|---|---|---|---|---|---|---|---|---|
| GDP per capita | $21,401 | $25,319 | $40,080 | $44,818 | $53,503 | $48,617 | $45,987 | $47,291 |
| Total GDP | $1.3B | $1.7B | $2.8B | $3.3B | $4.1B | $4B | $4.3B | $4.6B |
Source: [Link] Kummu, M., Kosonen, M. & Masoumzadeh Sayyar, S. Downscaled gridded global dataset for gross domestic product (GDP) per capita PPP over 1990–2022. Sci Data 12, 178 (2025) doi:10.1038/s41597-025-04487-x
Postal Code T0B CO2 Emissions
Carbon Dioxide (CO2) Emissions Per Capita in Tonnes Per Year
| Location | CO2 Emissions | CO2 Emissions Per Capita | CO2 Emissions Intensity |
|---|---|---|---|
| Postal Code T0B | 1,215,570 tn | 15.54 tn | 37.4 tons/km² |
| Alberta | 74,477,019 tn | 16.12 tn | 112.3 tons/km² |
| Canada | 521,999,336 tn | 14.7 tn | 52.9 tons/km² |
Sources: [Link] Moran, D., Kanemoto K; Jiborn, M., Wood, R., Többen, J., and Seto, K.C. (2018) Carbon footprints of 13,000 cities. Environmental Research Letters DOI: 10.1088/1748-9326/aac72a
Postal Code T0B CO2 Emissions
| 2013 CO2 emissions (tonnes/year) | 1,215,570 tn |
| 2013 CO2 emissions (tonnes/year) per capita | 15.54 tn |
| 2013 CO2 emissions intensity (tonnes/km²/year) | 37.4 tons/km² |
Natural Hazards Risk
Relative risk out of 10
| Hazard | Risk Level |
|---|---|
| Drought | High (7.9) |
* Risk, particularly concerning flood or landslide, may not be for the entire area.
Postal Code Extensions (81)
About Our Data
The data on this page is estimated using a number of publicly available tools and resources. It is provided without warranty, and could contain inaccuracies. Use at your own risk.