Postal Code 21100 - Finland
Finland
| Area of Postal Code 21100 | 52.9 km² |
| Population | 9,383 |
| Male Population | 4,566 (48.7%) |
| Female Population | 4,817 (51.3%) |
| Population change from 1975 to 2020 | -30.9% |
| Population change from 2000 to 2020 | -18.2% |
| Median Age | 45 years |
| Male Median Age | 44 years |
| Female Median Age | 46 years |
| Neighborhoods | Keskusta, Kultaranta, Nuhjala |
| Timezone | Eastern European Summer Time |
| Coordinates | 60.42922955022829° / 21.93940140977021° |
| Related Postal Codes | 21000, 21101, 21110, 21120, 21130, 21140, 21150, 21160, 21180, 21200 |
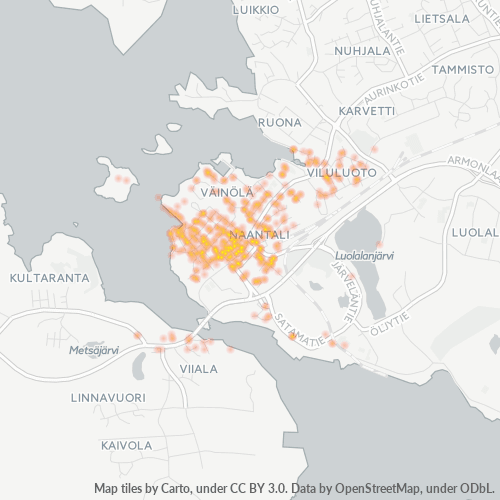
Map of Postal Code 21100 - Finland
Interactive Map
Postal Code 21100 - Finland Population
Years 1975 to 2030
| Data | 1975 | 1990 | 2000 | 2015 | 2020 | 2025* | 2030* |
|---|---|---|---|---|---|---|---|
| Population | 13,579 | 12,401 | 11,468 | 10,526 | 9,383 | 9,445 | 9,342 |
| Population Density | 256.5 / km² | 234.2 / km² | 216.6 / km² | 198.8 / km² | 177.2 / km² | 178.4 / km² | 176.5 / km² |
* Projected
Sources: JRC (European Commission's Joint Research Centre) work on the GHS built-up gridPostal Code 21100 - Finland Population change from 2000 to 2020
Decrease of 18.2% from year 2000 to 2020
| Location | Change since 1975 | Change since 1990 | Change since 2000 |
|---|---|---|---|
| Postal Code 21100 - Finland | -30.9% | -24.3% | -18.2% |
| Finland | — | — | — |
Sources: JRC (European Commission's Joint Research Centre) work on the GHS built-up grid
Postal Code 21100 - Finland Median Age
Median Age: 45 years
| Location | Median Age | Median Age (Female) | Median Age (Male) |
|---|---|---|---|
| Postal Code 21100 - Finland | 45 yrs | 46 yrs | 44 yrs |
| Finland | 42.4 yrs | 44 yrs | 40.7 yrs |
Sources: CIESIN (Center for International Earth Science Information Network)
Postal Code 21100 Population Density
Population Density: 177 / km²
| Location | Population | Area | Density |
|---|---|---|---|
| Postal Code 21100 | 9,383 | 52.9 km² | 177 / km² |
| Finland | 5.3 million | 334,788.7 km² | 15.9 / km² |
Sources: JRC (European Commission's Joint Research Centre) work on the GHS built-up grid
Postal Code 21100 - Finland Historical and Projected Population
Estimated Population from 1750 to 2100
Sources:
- JRC (European Commission's Joint Research Centre) work on the GHS built-up grid
- CIESIN (Center for International Earth Science Information Network)
- [Link] Klein Goldewijk, K., Beusen, A., Doelman, J., and Stehfest, E.: Anthropogenic land use estimates for the Holocene – HYDE 3.2, Earth Syst. Sci. Data, 9, 927–953, https://doi.org/10.5194/essd-9-927-2017, 2017.
Neighborhoods
Business Distribution by neighborhood in Postal Code 21100 - Finland
Area Codes
Percentage Area Codes used by businesses in Postal Code 21100 - Finland
Business Concentration in Postal Code 21100 - Finland
Industries
Business Distribution by Industry in Postal Code 21100 - Finland
| Industry Description | Number of Establishments | Average Age of Business |
|---|---|---|
| Beauty salons | 33 | — |
| Construction of buildings | 44 | 26.3 years |
| Corporate management | 52 | 22.6 years |
| Public parks | 25 | — |
| Real estate | 39 | 31.8 years |
| Restaurants | 60 | 8 years |
| Shopping | 24 | 26.4 years |
| Wholesale of construction supplies | 81 | 32.4 years |
Business distribution by price for Postal Code 21100 - Finland
Human Development Index (HDI)
Statistic composite index of life expectancy, education, and per capita income.
Source: [Link] Kummu, M., Taka, M. &Guillaume, J. Gridded global datasets for Gross Domestic Product and Human Development Index over 1990–2015. Sci Data 5, 180004 (2018) doi:10.1038/sdata.2018.4
Postal Code 21100 - Finland Gross Domestic Product (GDP)
GDP per capita, PPP (constant 2017 international $)
| Data | 1990 | 1995 | 2000 | 2005 | 2010 | 2015 | 2020 | 2022 |
|---|---|---|---|---|---|---|---|---|
| GDP per capita | $33,650 | $32,006 | $40,277 | $45,541 | $42,315 | $41,225 | $44,958 | $46,731 |
| Total GDP | $447.5M | $448M | $575.1M | $659.1M | $622.8M | $607.8M | $668.9M | $698M |
Source: [Link] Kummu, M., Kosonen, M. & Masoumzadeh Sayyar, S. Downscaled gridded global dataset for gross domestic product (GDP) per capita PPP over 1990–2022. Sci Data 12, 178 (2025) doi:10.1038/s41597-025-04487-x
Postal Code 21100 CO2 Emissions
Carbon Dioxide (CO2) Emissions Per Capita in Tonnes Per Year
| Location | CO2 Emissions | CO2 Emissions Per Capita | CO2 Emissions Intensity |
|---|---|---|---|
| Postal Code 21100 | 26,395 tn | 2.81 tn | 498.6 tons/km² |
| Finland | 54,177,521 tn | 10.19 tn | 161.8 tons/km² |
Sources: [Link] Moran, D., Kanemoto K; Jiborn, M., Wood, R., Többen, J., and Seto, K.C. (2018) Carbon footprints of 13,000 cities. Environmental Research Letters DOI: 10.1088/1748-9326/aac72a
Postal Code 21100 CO2 Emissions
| 2013 CO2 emissions (tonnes/year) | 26,395 tn |
| 2013 CO2 emissions (tonnes/year) per capita | 2.81 tn |
| 2013 CO2 emissions intensity (tonnes/km²/year) | 498.6 tons/km² |
About Our Data
The data on this page is estimated using a number of publicly available tools and resources. It is provided without warranty, and could contain inaccuracies. Use at your own risk.