Postal Code 36200 - Finland
Finland
| Area of Postal Code 36200 | 171.5 km² |
| Population | 9,840 |
| Male Population | 4,866 (49.5%) |
| Female Population | 4,974 (50.5%) |
| Population change from 1975 to 2020 | +30.6% |
| Population change from 2000 to 2020 | +16.3% |
| Median Age | 40.8 years |
| Male Median Age | 39.9 years |
| Female Median Age | 41.7 years |
| Neighborhoods | Huutijärvi, Ranta-Koivisto |
| Timezone | Eastern European Summer Time |
| Coordinates | 61.45080201572804° / 24.05572233687204° |
| Related Postal Codes | 35800, 36100, 36110, 36201, 36220, 36221, 36240, 36270, 36280, 36450 |
Map of Postal Code 36200 - Finland
Interactive Map
Postal Code 36200 - Finland Population
Years 1975 to 2030
| Data | 1975 | 1990 | 2000 | 2015 | 2020 | 2025* | 2030* |
|---|---|---|---|---|---|---|---|
| Population | 7,536 | 8,544 | 8,460 | 8,843 | 9,840 | 9,953 | 9,946 |
| Population Density | 43.9 / km² | 49.8 / km² | 49.3 / km² | 51.6 / km² | 57.4 / km² | 58 / km² | 58 / km² |
* Projected
Sources: JRC (European Commission's Joint Research Centre) work on the GHS built-up gridPostal Code 36200 - Finland Population change from 2000 to 2020
Increase of 16.3% from year 2000 to 2020
| Location | Change since 1975 | Change since 1990 | Change since 2000 |
|---|---|---|---|
| Postal Code 36200 - Finland | +30.6% | +15.2% | +16.3% |
| Finland | — | — | — |
Sources: JRC (European Commission's Joint Research Centre) work on the GHS built-up grid
Postal Code 36200 - Finland Median Age
Median Age: 40.8 years
| Location | Median Age | Median Age (Female) | Median Age (Male) |
|---|---|---|---|
| Postal Code 36200 - Finland | 40.8 yrs | 41.7 yrs | 39.9 yrs |
| Finland | 42.4 yrs | 44 yrs | 40.7 yrs |
Sources: CIESIN (Center for International Earth Science Information Network)
Postal Code 36200 Population Density
Population Density: 57.4 / km²
| Location | Population | Area | Density |
|---|---|---|---|
| Postal Code 36200 | 9,840 | 171.5 km² | 57.4 / km² |
| Finland | 5.3 million | 334,788.7 km² | 15.9 / km² |
Sources: JRC (European Commission's Joint Research Centre) work on the GHS built-up grid
Postal Code 36200 - Finland Historical and Projected Population
Estimated Population from 1720 to 2100
Sources:
- JRC (European Commission's Joint Research Centre) work on the GHS built-up grid
- CIESIN (Center for International Earth Science Information Network)
- [Link] Klein Goldewijk, K., Beusen, A., Doelman, J., and Stehfest, E.: Anthropogenic land use estimates for the Holocene – HYDE 3.2, Earth Syst. Sci. Data, 9, 927–953, https://doi.org/10.5194/essd-9-927-2017, 2017.
Area Codes
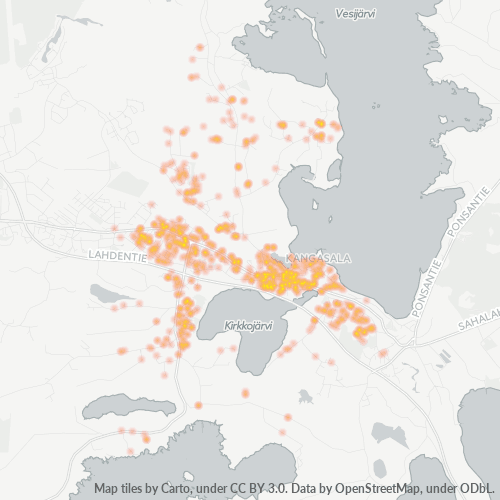
Percentage Area Codes used by businesses in Postal Code 36200 - Finland
Business Concentration in Postal Code 36200 - Finland
Industries
Business Distribution by Industry in Postal Code 36200 - Finland
| Industry Description | Number of Establishments |
|---|---|
| Beauty salons | 24 |
| Construction of buildings | 20 |
| Restaurants | 31 |
| Businesses | 3,978 |
| Estimated total revenue | ~€128.6M |
| Median revenue per business | ~€81.9K |
| Estimated jobs | 2,241 |
| Estimated payroll | ~€75.8M |
| Industries | Businesses | Total revenue | Median | Jobs |
|---|---|---|---|---|
| Wholesale and retail trade; repair of motor vehicles and motorcycles | 226 | ~€20.9M | ~€79.3K | 240 |
| Human health and social work activities | 104 | ~€17.2M | ~€127.2K | 370 |
| Professional, scientific and technical activities | 128 | ~€9.8M | ~€86.9K | 145 |
| Construction | 166 | ~€9.7M | ~€121.4K | 142 |
| Other service activities | 220 | ~€7.3M | ~€71.2K | 170 |
| Accommodation and food service activities | 109 | ~€6.6M | ~€96.2K | 147 |
| Transportation and storage | 123 | ~€4.9M | ~€149.5K | 88 |
| Arts, entertainment and recreation | 131 | ~€4.6M | ~€77.4K | 100 |
Largest businesses by estimated revenue
- S-market Kangasala — Kangasala · ~€4.5M
- Kangasalan Vesi Oy — Kangasala · ~€2.2M
- Kangasalan Kiinteistöpalvelu Oy — Kangasala · ~€2.0M
- Kangasalan Terveyskeskuksen Päivystys — Kangasala · ~€1.7M
- Kangasalan Waste station — Kangasala · ~€1.7M
median from the 872 of 3,978 businesses with estimates Estimate based on moderate signals
Postal Code 36200 - Finland — Revenue trend
Median business revenue by year
| Year | 2019 | 2020 | 2021 | 2022 | 2023 | 2024 |
|---|---|---|---|---|---|---|
| Median revenue per business | ~€99.5K | ~€95.6K | ~€93.0K | ~€91.0K | ~€86.8K | ~€83.4K |
Revenue modeled for the same 872 businesses across all years. Estimate based on moderate signals
Business distribution by price for Postal Code 36200 - Finland
Human Development Index (HDI)
Statistic composite index of life expectancy, education, and per capita income.
Source: [Link] Kummu, M., Taka, M. &Guillaume, J. Gridded global datasets for Gross Domestic Product and Human Development Index over 1990–2015. Sci Data 5, 180004 (2018) doi:10.1038/sdata.2018.4
Postal Code 36200 - Finland Gross Domestic Product (GDP)
GDP per capita, PPP (constant 2017 international $)
| Data | 1990 | 1995 | 2000 | 2005 | 2010 | 2015 | 2020 | 2022 |
|---|---|---|---|---|---|---|---|---|
| GDP per capita | $32,289 | $30,712 | $38,648 | $45,589 | $44,706 | $41,548 | $45,479 | $47,273 |
| Total GDP | $382.1M | $380.1M | $490.3M | $595.8M | $609.9M | $585.3M | $631.1M | $660M |
Source: [Link] Kummu, M., Kosonen, M. & Masoumzadeh Sayyar, S. Downscaled gridded global dataset for gross domestic product (GDP) per capita PPP over 1990–2022. Sci Data 12, 178 (2025) doi:10.1038/s41597-025-04487-x
Postal Code 36200 CO2 Emissions
Carbon Dioxide (CO2) Emissions Per Capita in Tonnes Per Year
| Location | CO2 Emissions | CO2 Emissions Per Capita | CO2 Emissions Intensity |
|---|---|---|---|
| Postal Code 36200 | 102,424 tn | 10.41 tn | 597.2 tons/km² |
| Finland | 54,177,521 tn | 10.19 tn | 161.8 tons/km² |
Sources: [Link] Moran, D., Kanemoto K; Jiborn, M., Wood, R., Többen, J., and Seto, K.C. (2018) Carbon footprints of 13,000 cities. Environmental Research Letters DOI: 10.1088/1748-9326/aac72a
Postal Code 36200 CO2 Emissions
| 2013 CO2 emissions (tonnes/year) | 102,424 tn |
| 2013 CO2 emissions (tonnes/year) per capita | 10.41 tn |
| 2013 CO2 emissions intensity (tonnes/km²/year) | 597.2 tons/km² |
About Our Data
The data on this page is estimated using a number of publicly available tools and resources. It is provided without warranty, and could contain inaccuracies. Use at your own risk.