Postal Code 73100 - Finland
Finland
| Area of Postal Code 73100 | 356.5 km² |
| Population | 4,708 |
| Male Population | 2,368 (50.3%) |
| Female Population | 2,340 (49.7%) |
| Population change from 1975 to 2015 | -48.9% |
| Population change from 2000 to 2015 | -31.5% |
| Median Age | 47.2 years |
| Male Median Age | 46.1 years |
| Female Median Age | 48.4 years |
| Timezone | Eastern European Summer Time |
| Coordinates | 63.37969588290478° / 27.43979724917716° |
| Related Postal Codes | 72600, 73101, 73110, 73120, 73140, 73200, 73201, 73230, 73300, 73301 |
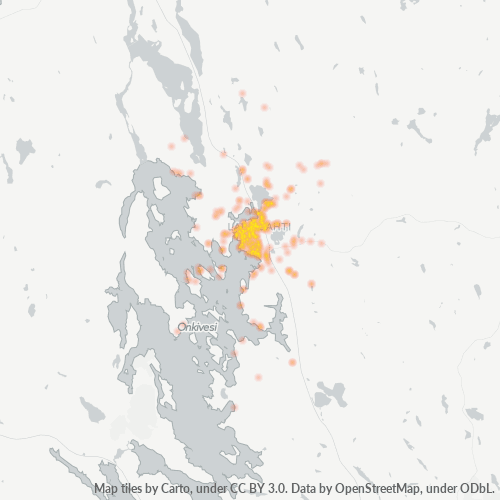
Map of Postal Code 73100 - Finland
Interactive Map
Postal Code 73100 - Finland Population
Years 1975 to 2020
| Data | 1975 | 1990 | 2000 | 2015 | 2020 |
|---|---|---|---|---|---|
| Population | 9,218 | 8,051 | 6,878 | 4,708 | 4,747 |
| Population Density | 25.9 / km² | 22.6 / km² | 19.3 / km² | 13.2 / km² | 13.3 / km² |
Sources: JRC (European Commission's Joint Research Centre) work on the GHS built-up grid
Postal Code 73100 - Finland Population change from 2000 to 2015
Decrease of 31.5% from year 2000 to 2015
| Location | Change since 1975 | Change since 1990 | Change since 2000 |
|---|---|---|---|
| Postal Code 73100 - Finland | -48.9% | -41.5% | -31.5% |
| Finland | +16.3% | +10.2% | +6.2% |
Sources: JRC (European Commission's Joint Research Centre) work on the GHS built-up grid
Postal Code 73100 - Finland Median Age
Median Age: 47.2 years
| Location | Median Age | Median Age (Female) | Median Age (Male) |
|---|---|---|---|
| Postal Code 73100 - Finland | 47.2 yrs | 48.4 yrs | 46.1 yrs |
| Finland | 42.4 yrs | 44 yrs | 40.7 yrs |
Sources: CIESIN (Center for International Earth Science Information Network)
Postal Code 73100 Population Density
Population Density: 13.2 / km²
| Location | Population | Area | Density |
|---|---|---|---|
| Postal Code 73100 | 4,708 | 356.5 km² | 13.2 / km² |
| Finland | 5.3 million | 334,788.7 km² | 15.9 / km² |
Sources: JRC (European Commission's Joint Research Centre) work on the GHS built-up grid
Postal Code 73100 - Finland Historical and Projected Population
Estimated Population from 1200 to 2100
Sources:
- JRC (European Commission's Joint Research Centre) work on the GHS built-up grid
- CIESIN (Center for International Earth Science Information Network)
- [Link] Klein Goldewijk, K., Beusen, A., Doelman, J., and Stehfest, E.: Anthropogenic land use estimates for the Holocene – HYDE 3.2, Earth Syst. Sci. Data, 9, 927–953, https://doi.org/10.5194/essd-9-927-2017, 2017.
Area Codes
Percentage Area Codes used by businesses in Postal Code 73100 - Finland
Business Concentration in Postal Code 73100 - Finland
Industries
Business Distribution by Industry in Postal Code 73100 - Finland
| Industry Description | Number of Establishments | Average Age of Business |
|---|---|---|
| All membership organizations | 11 | — |
| Beauty salons | 26 | — |
| Buses and trains | 11 | — |
| Corporate management | 16 | 23.3 years |
| Forestry and logging | 35 | — |
| Real estate | 15 | — |
| Restaurants | 11 | — |
| Shopping | 14 | — |
| Unreachable | 14 | — |
| Wholesale of construction supplies | 45 | 26.1 years |
Human Development Index (HDI)
Statistic composite index of life expectancy, education, and per capita income.
Source: [Link] Kummu, M., Taka, M. &Guillaume, J. Gridded global datasets for Gross Domestic Product and Human Development Index over 1990–2015. Sci Data 5, 180004 (2018) doi:10.1038/sdata.2018.4
Postal Code 73100 CO2 Emissions
Carbon Dioxide (CO2) Emissions Per Capita in Tonnes Per Year
| Location | CO2 Emissions | CO2 Emissions Per Capita | CO2 Emissions Intensity |
|---|---|---|---|
| Postal Code 73100 | 46,037 tn | 9.78 tn | 129.1 tons/km² |
| Finland | 54,177,521 tn | 10.19 tn | 161.8 tons/km² |
Sources: [Link] Moran, D., Kanemoto K; Jiborn, M., Wood, R., Többen, J., and Seto, K.C. (2018) Carbon footprints of 13,000 cities. Environmental Research Letters DOI: 10.1088/1748-9326/aac72a
Postal Code 73100 CO2 Emissions
| 2013 CO2 emissions (tonnes/year) | 46,037 tn |
| 2013 CO2 emissions (tonnes/year) per capita | 9.78 tn |
| 2013 CO2 emissions intensity (tonnes/km²/year) | 129.1 tons/km² |
About Our Data
The data on this page is estimated using a number of publicly available tools and resources. It is provided without warranty, and could contain inaccuracies. Use at your own risk.