Postal Code 85800 - Finland
Finland
| Area of Postal Code 85800 | 306 km² |
| Population | 5,565 |
| Male Population | 2,820 (50.7%) |
| Female Population | 2,745 (49.3%) |
| Population change from 1975 to 2020 | -10.0% |
| Population change from 2000 to 2020 | -21.5% |
| Median Age | 42.9 years |
| Male Median Age | 41.3 years |
| Female Median Age | 44.6 years |
| Timezone | Eastern European Summer Time |
| Coordinates | 63.70447899525255° / 25.340703887005322° |
| Related Postal Codes | 85501, 85540, 85560, 85580, 85620, 85801, 85820, 85840, 85900, 85920 |
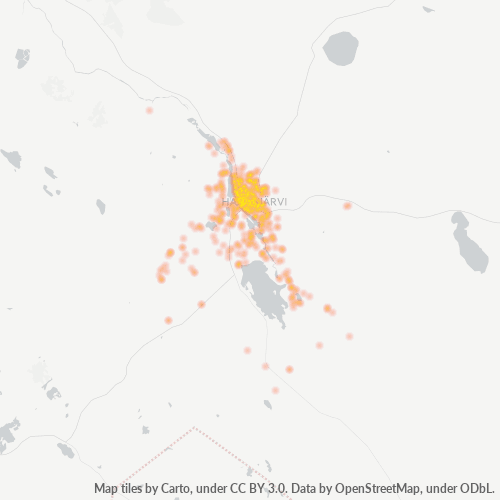
Map of Postal Code 85800 - Finland
Interactive Map
Postal Code 85800 - Finland Population
Years 1975 to 2030
| Data | 1975 | 1990 | 2000 | 2015 | 2020 | 2025* | 2030* |
|---|---|---|---|---|---|---|---|
| Population | 6,180 | 6,775 | 7,086 | 6,757 | 5,565 | 5,705 | 5,855 |
| Population Density | 20.2 / km² | 22.1 / km² | 23.2 / km² | 22.1 / km² | 18.2 / km² | 18.6 / km² | 19.1 / km² |
* Projected
Sources: JRC (European Commission's Joint Research Centre) work on the GHS built-up gridPostal Code 85800 - Finland Population change from 2000 to 2020
Decrease of 21.5% from year 2000 to 2020
| Location | Change since 1975 | Change since 1990 | Change since 2000 |
|---|---|---|---|
| Postal Code 85800 - Finland | -10% | -17.9% | -21.5% |
| Finland | — | — | — |
Sources: JRC (European Commission's Joint Research Centre) work on the GHS built-up grid
Postal Code 85800 - Finland Median Age
Median Age: 42.9 years
| Location | Median Age | Median Age (Female) | Median Age (Male) |
|---|---|---|---|
| Postal Code 85800 - Finland | 42.9 yrs | 44.6 yrs | 41.3 yrs |
| Finland | 42.4 yrs | 44 yrs | 40.7 yrs |
Sources: CIESIN (Center for International Earth Science Information Network)
Postal Code 85800 Population Density
Population Density: 18.2 / km²
| Location | Population | Area | Density |
|---|---|---|---|
| Postal Code 85800 | 5,565 | 306 km² | 18.2 / km² |
| Finland | 5.3 million | 334,788.7 km² | 15.9 / km² |
Sources: JRC (European Commission's Joint Research Centre) work on the GHS built-up grid
Postal Code 85800 - Finland Historical and Projected Population
Estimated Population from 1600 to 2100
Sources:
- JRC (European Commission's Joint Research Centre) work on the GHS built-up grid
- CIESIN (Center for International Earth Science Information Network)
- [Link] Klein Goldewijk, K., Beusen, A., Doelman, J., and Stehfest, E.: Anthropogenic land use estimates for the Holocene – HYDE 3.2, Earth Syst. Sci. Data, 9, 927–953, https://doi.org/10.5194/essd-9-927-2017, 2017.
Area Codes
Percentage Area Codes used by businesses in Postal Code 85800 - Finland
Business Concentration in Postal Code 85800 - Finland
Industries
Business Distribution by Industry in Postal Code 85800 - Finland
| Industry Description | Number of Establishments | Average Age of Business |
|---|---|---|
| Beauty salons | 7 | — |
| Hardware store | 5 | 27.2 years |
| Restaurants | 17 | — |
| Shopping | 5 | — |
| Businesses | 1,838 |
| Estimated total revenue | ~€100.0M |
| Median revenue per business | ~€97.5K |
| Estimated jobs | 1,450 |
| Estimated payroll | ~€49.2M |
| Industries | Businesses | Total revenue | Median | Jobs |
|---|---|---|---|---|
| Wholesale and retail trade; repair of motor vehicles and motorcycles | 146 | ~€34.8M | ~€183.6K | 302 |
| Human health and social work activities | 34 | ~€11.1M | ~€266.3K | 171 |
| Transportation and storage | 93 | ~€7.0M | ~€156.0K | 107 |
| Construction | 64 | ~€5.3M | ~€125.9K | 70 |
| Other service activities | 92 | ~€4.1M | ~€91.3K | 92 |
| Public administration and defence; compulsory social security | 16 | ~€3.5M | ~€244.0K | 26 |
| Professional, scientific and technical activities | 62 | ~€3.2M | ~€107.9K | 59 |
| Accommodation and food service activities | 45 | ~€3.2M | ~€95.4K | 64 |
Largest businesses by estimated revenue
- K-Supermarket Haapajärvi — Haapajärvi · ~€3.6M
- S-market Haapajärvi — Haapajärvi · ~€3.4M
- ABC Haapajärvi liikenneasema — Haapajärvi · ~€2.6M
- Terveysasema — Haapajärvi · ~€2.3M
- Haapajärven kaupunki — Haapajärvi · ~€2.1M
median from the 500 of 1,838 businesses with estimates Estimate based on moderate signals
Postal Code 85800 - Finland — Revenue trend
Median business revenue by year
| Year | 2019 | 2020 | 2021 | 2022 | 2023 | 2024 |
|---|---|---|---|---|---|---|
| Median revenue per business | ~€139.3K | ~€133.8K | ~€128.6K | ~€125.5K | ~€111.5K | ~€111.9K |
Revenue modeled for the same 500 businesses across all years. Estimate based on moderate signals
Business distribution by price for Postal Code 85800 - Finland
Human Development Index (HDI)
Statistic composite index of life expectancy, education, and per capita income.
Source: [Link] Kummu, M., Taka, M. &Guillaume, J. Gridded global datasets for Gross Domestic Product and Human Development Index over 1990–2015. Sci Data 5, 180004 (2018) doi:10.1038/sdata.2018.4
Postal Code 85800 - Finland Gross Domestic Product (GDP)
GDP per capita, PPP (constant 2017 international $)
| Data | 1990 | 1995 | 2000 | 2005 | 2010 | 2015 | 2020 | 2022 |
|---|---|---|---|---|---|---|---|---|
| GDP per capita | $30,582 | $29,088 | $36,605 | $43,327 | $41,044 | $37,043 | $41,203 | $42,828 |
| Total GDP | $160.8M | $158.1M | $201.2M | $243.5M | $238M | $219.1M | $247.9M | $260.2M |
Source: [Link] Kummu, M., Kosonen, M. & Masoumzadeh Sayyar, S. Downscaled gridded global dataset for gross domestic product (GDP) per capita PPP over 1990–2022. Sci Data 12, 178 (2025) doi:10.1038/s41597-025-04487-x
Postal Code 85800 CO2 Emissions
Carbon Dioxide (CO2) Emissions Per Capita in Tonnes Per Year
| Location | CO2 Emissions | CO2 Emissions Per Capita | CO2 Emissions Intensity |
|---|---|---|---|
| Postal Code 85800 | 53,228 tn | 9.56 tn | 173.9 tons/km² |
| Finland | 54,177,521 tn | 10.19 tn | 161.8 tons/km² |
Sources: [Link] Moran, D., Kanemoto K; Jiborn, M., Wood, R., Többen, J., and Seto, K.C. (2018) Carbon footprints of 13,000 cities. Environmental Research Letters DOI: 10.1088/1748-9326/aac72a
Postal Code 85800 CO2 Emissions
| 2013 CO2 emissions (tonnes/year) | 53,228 tn |
| 2013 CO2 emissions (tonnes/year) per capita | 9.56 tn |
| 2013 CO2 emissions intensity (tonnes/km²/year) | 173.9 tons/km² |
About Our Data
The data on this page is estimated using a number of publicly available tools and resources. It is provided without warranty, and could contain inaccuracies. Use at your own risk.