Postal Code 67-200 - Poland
Poland
| Area of Postal Code 67-200 | 57.8 km² |
| Population | 72,743 |
| Male Population | 35,894 (49.3%) |
| Female Population | 36,849 (50.7%) |
| Population change from 1975 to 2015 | +11.3% |
| Population change from 2000 to 2015 | -0.5% |
| Median Age | 36.2 years |
| Male Median Age | 35.1 years |
| Female Median Age | 37.2 years |
| Area Codes | 76 |
| Associated Cities | Głogów |
| Neighborhoods | Os. Kopernik, Os. Kościuszki, Os. Piastów Śląskich, Stare Miasto, Widziszów |
| Timezone | Central European Summer Time |
| Coordinates | 51.66016379937641° / 16.084402728698812° |
| Related Postal Codes | 67-202, 67-203, 67-204, 67-205, 67-206, 67-210, 67-221, 67-222, 67-231, 67-232 |
Map of Postal Code 67-200 - Poland
Interactive Map
Postal Code 67-200 - Poland Population
Years 1975 to 2020
| Data | 1975 | 1990 | 2000 | 2015 | 2020 |
|---|---|---|---|---|---|
| Population | 65,329 | 72,795 | 73,120 | 72,743 | 74,482 |
| Population Density | 1,130.4 / km² | 1,259.6 / km² | 1,265.3 / km² | 1,258.7 / km² | 1,288.8 / km² |
Sources: JRC (European Commission's Joint Research Centre) work on the GHS built-up grid
Postal Code 67-200 - Poland Population change from 2000 to 2015
Decrease of 0.5% from year 2000 to 2015
| Location | Change since 1975 | Change since 1990 | Change since 2000 |
|---|---|---|---|
| Postal Code 67-200 - Poland | +11.3% | -0.1% | -0.5% |
| Poland | +13% | +1.1% | +0.3% |
Sources: JRC (European Commission's Joint Research Centre) work on the GHS built-up grid
Postal Code 67-200 - Poland Median Age
Median Age: 36.2 years
| Location | Median Age | Median Age (Female) | Median Age (Male) |
|---|---|---|---|
| Postal Code 67-200 - Poland | 36.2 yrs | 37.2 yrs | 35.1 yrs |
| Poland | 35 yrs | 35.6 yrs | 34.3 yrs |
Sources: CIESIN (Center for International Earth Science Information Network)
Postal Code 67-200 Population Density
Population Density: 1,259 / km²
| Location | Population | Area | Density |
|---|---|---|---|
| Postal Code 67-200 | 72,743 | 57.8 km² | 1,259 / km² |
| Poland | 38.5 million | 312,592.3 km² | 123 / km² |
Sources: JRC (European Commission's Joint Research Centre) work on the GHS built-up grid
Postal Code 67-200 - Poland Historical and Projected Population
Estimated Population from 100 to 2100
Sources:
- JRC (European Commission's Joint Research Centre) work on the GHS built-up grid
- CIESIN (Center for International Earth Science Information Network)
- [Link] Klein Goldewijk, K., Beusen, A., Doelman, J., and Stehfest, E.: Anthropogenic land use estimates for the Holocene – HYDE 3.2, Earth Syst. Sci. Data, 9, 927–953, https://doi.org/10.5194/essd-9-927-2017, 2017.
Area Codes
Percentage Area Codes used by businesses in Postal Code 67-200 - Poland
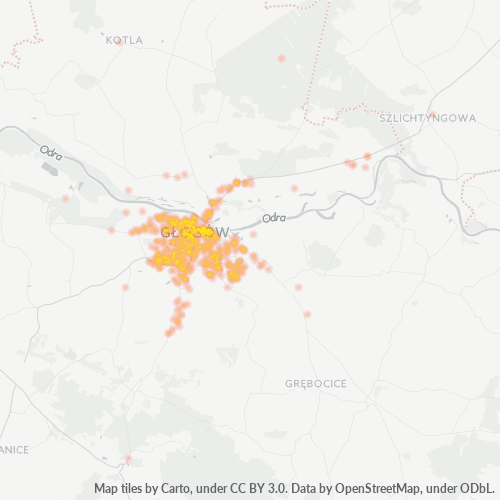
Business Concentration in Postal Code 67-200 - Poland
Business distribution by price for Postal Code 67-200 - Poland
Human Development Index (HDI)
Statistic composite index of life expectancy, education, and per capita income.
Source: [Link] Kummu, M., Taka, M. &Guillaume, J. Gridded global datasets for Gross Domestic Product and Human Development Index over 1990–2015. Sci Data 5, 180004 (2018) doi:10.1038/sdata.2018.4
Postal Code 67-200 CO2 Emissions
Carbon Dioxide (CO2) Emissions Per Capita in Tonnes Per Year
| Location | CO2 Emissions | CO2 Emissions Per Capita | CO2 Emissions Intensity |
|---|---|---|---|
| Postal Code 67-200 | 492,790 tn | 6.77 tn | 8,527.2 tons/km² |
| Poland | 230,825,573 tn | 5.99 tn | 738.4 tons/km² |
Sources: [Link] Moran, D., Kanemoto K; Jiborn, M., Wood, R., Többen, J., and Seto, K.C. (2018) Carbon footprints of 13,000 cities. Environmental Research Letters DOI: 10.1088/1748-9326/aac72a
Postal Code 67-200 CO2 Emissions
| 2013 CO2 emissions (tonnes/year) | 492,790 tn |
| 2013 CO2 emissions (tonnes/year) per capita | 6.77 tn |
| 2013 CO2 emissions intensity (tonnes/km²/year) | 8,527.2 tons/km² |
Recent Nearby Earthquakes
Magnitude 3.0 and greater
| Date▼ | Time↕ | Magnitude↕ | Distance↕ | Depth↕ | Location↕ | Link |
|---|---|---|---|---|---|---|
| 3/5/19 | 8:55 AM | 4.1 | 5.2 km | 5,000 m | 3km NNW of Grebocice, Poland | usgs.gov |
| 5/5/18 | 8:40 AM | 3.4 | 5 km | 5,000 m | 4km E of Glogow, Poland | usgs.gov |
| 12/7/17 | 9:42 AM | 4.5 | 9.3 km | 10,000 m | 5km WSW of Grebocice, Poland | usgs.gov |
| 11/29/16 | 12:09 PM | 4.2 | 7.3 km | 5,000 m | 1km NNW of Grebocice, Poland | usgs.gov |
| 8/13/16 | 5:00 AM | 4.7 | 11.3 km | 5,000 m | 5km SW of Grebocice, Poland | usgs.gov |
| 7/19/15 | 12:18 PM | 4 | 10.2 km | 1,000 m | 5km SW of Grebocice, Poland | usgs.gov |
| 7/7/15 | 11:53 PM | 4.7 | 7.7 km | 5,000 m | 6km W of Grebocice, Poland | usgs.gov |
| 10/25/14 | 8:53 PM | 4.1 | 11.8 km | 2,080 m | 5km N of Polkowice, Poland | usgs.gov |
| 7/5/14 | 5:04 AM | 4.3 | 11.2 km | 5,000 m | 4km SW of Grebocice, Poland | usgs.gov |
| 3/15/14 | 11:32 PM | 4.1 | 3.2 km | 5,000 m | 3km SSE of Glogow, Poland | usgs.gov |
Showing 1-10 of 500
…
Source: U.S. Geological Survey (USGS)
About Our Data
The data on this page is estimated using a number of publicly available tools and resources. It is provided without warranty, and could contain inaccuracies. Use at your own risk.