Postal Code 20140 - Spain
Spain
| Area of Postal Code 20140 | 27.1 km² |
| Population | 13,738 |
| Male Population | 6,864 (50.0%) |
| Female Population | 6,874 (50.0%) |
| Population change from 1975 to 2015 | -11.0% |
| Population change from 2000 to 2015 | -2.0% |
| Median Age | 42.7 years |
| Male Median Age | 41.4 years |
| Female Median Age | 43.9 years |
| Timezone | Central European Summer Time |
| Coordinates | 43.21627666181853° / -2.013347261776172° |
| Related Postal Codes | 20100, 20110, 20115, 20120, 20128, 20130, 20150, 20159, 20160, 20170 |
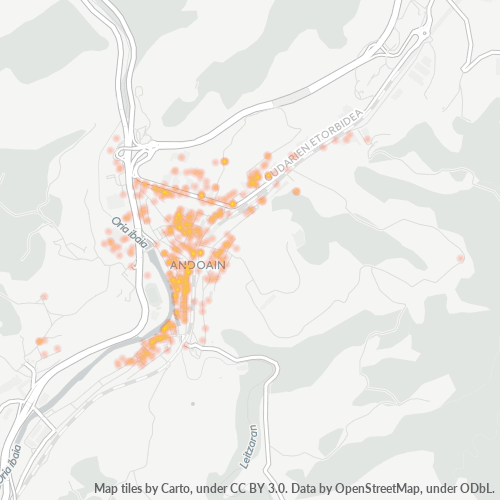
Map of Postal Code 20140 - Spain
Interactive Map
Postal Code 20140 - Spain Population
Years 1975 to 2020
| Data | 1975 | 1990 | 2000 | 2015 | 2020 |
|---|---|---|---|---|---|
| Population | 15,441 | 14,959 | 14,015 | 13,738 | 14,157 |
| Population Density | 569.1 / km² | 551.4 / km² | 516.6 / km² | 506.4 / km² | 521.8 / km² |
Sources: JRC (European Commission's Joint Research Centre) work on the GHS built-up grid
Postal Code 20140 - Spain Population change from 2000 to 2015
Decrease of 2% from year 2000 to 2015
| Location | Change since 1975 | Change since 1990 | Change since 2000 |
|---|---|---|---|
| Postal Code 20140 - Spain | -11% | -8.2% | -2% |
| Spain | +28.4% | +17.7% | +13.2% |
Sources: JRC (European Commission's Joint Research Centre) work on the GHS built-up grid
Postal Code 20140 - Spain Median Age
Median Age: 42.7 years
| Location | Median Age | Median Age (Female) | Median Age (Male) |
|---|---|---|---|
| Postal Code 20140 - Spain | 42.7 yrs | 43.9 yrs | 41.4 yrs |
| Spain | 40.9 yrs | 42 yrs | 39.7 yrs |
Sources: CIESIN (Center for International Earth Science Information Network)
Postal Code 20140 Population Density
Population Density: 506 / km²
| Location | Population | Area | Density |
|---|---|---|---|
| Postal Code 20140 | 13,738 | 27.1 km² | 506 / km² |
| Spain | 45.3 million | 505,993.5 km² | 89.5 / km² |
Sources: JRC (European Commission's Joint Research Centre) work on the GHS built-up grid
Postal Code 20140 - Spain Historical and Projected Population
Estimated Population from 0 to 2100
Sources:
- JRC (European Commission's Joint Research Centre) work on the GHS built-up grid
- CIESIN (Center for International Earth Science Information Network)
- [Link] Klein Goldewijk, K., Beusen, A., Doelman, J., and Stehfest, E.: Anthropogenic land use estimates for the Holocene – HYDE 3.2, Earth Syst. Sci. Data, 9, 927–953, https://doi.org/10.5194/essd-9-927-2017, 2017.
Area Codes
Percentage Area Codes used by businesses in Postal Code 20140 - Spain
Business Concentration in Postal Code 20140 - Spain
Industries
Business Distribution by Industry in Postal Code 20140 - Spain
| Industry Description | Number of Establishments |
|---|---|
| All food and beverage | 31 |
| Apartments | 18 |
| Bars, pubs and taverns | 45 |
| Beauty salons | 29 |
| Butcher | 23 |
| Car repair | 24 |
| Corporate management | 56 |
| Education | 26 |
| Electrical installation | 26 |
| Electronics stores | 18 |
| Grocery stores and supermarkets | 48 |
| Hairdressers | 24 |
| Real estate | 20 |
| Restaurants | 93 |
| Shopping | 40 |
| Shopping other | 24 |
| Transportation logistics | 18 |
| Wholesale of machinery | 33 |
Human Development Index (HDI)
Statistic composite index of life expectancy, education, and per capita income.
Source: [Link] Kummu, M., Taka, M. &Guillaume, J. Gridded global datasets for Gross Domestic Product and Human Development Index over 1990–2015. Sci Data 5, 180004 (2018) doi:10.1038/sdata.2018.4
Postal Code 20140 CO2 Emissions
Carbon Dioxide (CO2) Emissions Per Capita in Tonnes Per Year
| Location | CO2 Emissions | CO2 Emissions Per Capita | CO2 Emissions Intensity |
|---|---|---|---|
| Postal Code 20140 | 134,058 tn | 9.76 tn | 4,941.1 tons/km² |
| Spain | 330,097,501 tn | 7.29 tn | 652.4 tons/km² |
Sources: [Link] Moran, D., Kanemoto K; Jiborn, M., Wood, R., Többen, J., and Seto, K.C. (2018) Carbon footprints of 13,000 cities. Environmental Research Letters DOI: 10.1088/1748-9326/aac72a
Postal Code 20140 CO2 Emissions
| 2013 CO2 emissions (tonnes/year) | 134,058 tn |
| 2013 CO2 emissions (tonnes/year) per capita | 9.76 tn |
| 2013 CO2 emissions intensity (tonnes/km²/year) | 4,941.1 tons/km² |
Natural Hazards Risk
Relative risk out of 10
| Hazard | Risk Level |
|---|---|
| Earthquake | Medium (4) |
* Risk, particularly concerning flood or landslide, may not be for the entire area.
Recent Nearby Earthquakes
Magnitude 3.0 and greater
| Date▼ | Time↕ | Magnitude↕ | Distance↕ | Depth↕ | Location↕ | Link |
|---|---|---|---|---|---|---|
| 3/9/17 | 10:43 PM | 4.1 | 36.5 km | 2,650 m | 11km N of Oltza, Spain | usgs.gov |
| 4/20/13 | 8:18 AM | 4.3 | 61.1 km | — | 10km NNE of Yerri, Spain | usgs.gov |
| 3/22/13 | 7:57 PM | 4.2 | 43.8 km | 2,000 m | 4km SW of Oltza, Spain | usgs.gov |
| 12/11/08 | 1:07 PM | 3.3 | 81.4 km | 2,000 m | Pyrenees | usgs.gov |
| 12/2/08 | 3:48 AM | 3.1 | 87 km | 5,000 m | Pyrenees | usgs.gov |
| 10/10/08 | 6:31 AM | 3.3 | 82.5 km | 2,000 m | Pyrenees | usgs.gov |
| 9/28/08 | 6:56 AM | 3.1 | 85.1 km | 2,000 m | Pyrenees | usgs.gov |
| 9/16/08 | 12:00 AM | 3.1 | 80.1 km | 2,000 m | Pyrenees | usgs.gov |
| 7/25/08 | 2:24 PM | 3.2 | 60.1 km | — | Pyrenees | usgs.gov |
| 5/26/08 | 9:02 AM | 3.2 | 75.8 km | — | Pyrenees | usgs.gov |
Showing 1-10 of 141
…
Source: U.S. Geological Survey (USGS)
About Our Data
The data on this page is estimated using a number of publicly available tools and resources. It is provided without warranty, and could contain inaccuracies. Use at your own risk.