Postal Code 36205 - Spain
Spain
| Area of Postal Code 36205 | 1.032 km² |
| Population | 6,765 |
| Male Population | 3,225 (47.7%) |
| Female Population | 3,540 (52.3%) |
| Population change from 1975 to 2015 | -19.0% |
| Population change from 2000 to 2015 | -3.5% |
| Median Age | 42.7 years |
| Male Median Age | 40.8 years |
| Female Median Age | 44.5 years |
| Neighborhoods | Cabral, Lavadores, Sárdoma |
| Timezone | Central European Summer Time |
| Coordinates | 42.22931191312081° / -8.70054760828948° |
| Related Postal Codes | 36200, 36201, 36202, 36203, 36204, 36206, 36207, 36208, 36209, 36211 |
Map of Postal Code 36205 - Spain
Interactive Map
Postal Code 36205 - Spain Population
Years 1975 to 2020
| Data | 1975 | 1990 | 2000 | 2015 | 2020 |
|---|---|---|---|---|---|
| Population | 8,357 | 7,668 | 7,009 | 6,765 | 7,035 |
| Population Density | 8,096.9 / km² | 7,429.4 / km² | 6,790.9 / km² | 6,554.5 / km² | 6,816.1 / km² |
Sources: JRC (European Commission's Joint Research Centre) work on the GHS built-up grid
Postal Code 36205 - Spain Population change from 2000 to 2015
Decrease of 3.5% from year 2000 to 2015
| Location | Change since 1975 | Change since 1990 | Change since 2000 |
|---|---|---|---|
| Postal Code 36205 - Spain | -19% | -11.8% | -3.5% |
| Spain | +28.4% | +17.7% | +13.2% |
Sources: JRC (European Commission's Joint Research Centre) work on the GHS built-up grid
Postal Code 36205 - Spain Median Age
Median Age: 42.7 years
| Location | Median Age | Median Age (Female) | Median Age (Male) |
|---|---|---|---|
| Postal Code 36205 - Spain | 42.7 yrs | 44.5 yrs | 40.8 yrs |
| Spain | 40.9 yrs | 42 yrs | 39.7 yrs |
Sources: CIESIN (Center for International Earth Science Information Network)
Postal Code 36205 Population Density
Population Density: 6,555 / km²
| Location | Population | Area | Density |
|---|---|---|---|
| Postal Code 36205 | 6,765 | 1.032 km² | 6,555 / km² |
| Spain | 45.3 million | 505,993.5 km² | 89.5 / km² |
Sources: JRC (European Commission's Joint Research Centre) work on the GHS built-up grid
Postal Code 36205 - Spain Historical and Projected Population
Estimated Population from 0 to 2100
Sources:
- JRC (European Commission's Joint Research Centre) work on the GHS built-up grid
- CIESIN (Center for International Earth Science Information Network)
- [Link] Klein Goldewijk, K., Beusen, A., Doelman, J., and Stehfest, E.: Anthropogenic land use estimates for the Holocene – HYDE 3.2, Earth Syst. Sci. Data, 9, 927–953, https://doi.org/10.5194/essd-9-927-2017, 2017.
Neighborhoods
Business Distribution by neighborhood in Postal Code 36205 - Spain
Area Codes
Percentage Area Codes used by businesses in Postal Code 36205 - Spain
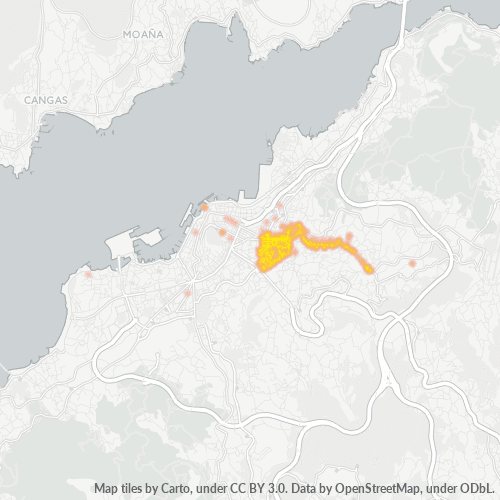
Business Concentration in Postal Code 36205 - Spain
Industries
Business Distribution by Industry in Postal Code 36205 - Spain
| Industry Description | Number of Establishments |
|---|---|
| All food and beverage | 53 |
| Bakeries | 53 |
| Banks | 40 |
| Bars, pubs and taverns | 61 |
| Beauty salons | 80 |
| Cafes | 84 |
| Car repair | 46 |
| Clothing stores | 47 |
| Construction of buildings | 44 |
| Corporate management | 62 |
| Education | 47 |
| Grocery stores and supermarkets | 84 |
| Hairdressers | 62 |
| Real estate | 53 |
| Restaurants | 206 |
| Shopping | 136 |
| Shopping other | 41 |
| Wholesale of machinery | 40 |
Business distribution by price for Postal Code 36205 - Spain
Human Development Index (HDI)
Statistic composite index of life expectancy, education, and per capita income.
Source: [Link] Kummu, M., Taka, M. &Guillaume, J. Gridded global datasets for Gross Domestic Product and Human Development Index over 1990–2015. Sci Data 5, 180004 (2018) doi:10.1038/sdata.2018.4
Postal Code 36205 CO2 Emissions
Carbon Dioxide (CO2) Emissions Per Capita in Tonnes Per Year
| Location | CO2 Emissions | CO2 Emissions Per Capita | CO2 Emissions Intensity |
|---|---|---|---|
| Postal Code 36205 | 57,064 tn | 8.44 tn | 55,288.5 tons/km² |
| Spain | 330,097,501 tn | 7.29 tn | 652.4 tons/km² |
Sources: [Link] Moran, D., Kanemoto K; Jiborn, M., Wood, R., Többen, J., and Seto, K.C. (2018) Carbon footprints of 13,000 cities. Environmental Research Letters DOI: 10.1088/1748-9326/aac72a
Postal Code 36205 CO2 Emissions
| 2013 CO2 emissions (tonnes/year) | 57,064 tn |
| 2013 CO2 emissions (tonnes/year) per capita | 8.44 tn |
| 2013 CO2 emissions intensity (tonnes/km²/year) | 55,288.5 tons/km² |
Natural Hazards Risk
Relative risk out of 10
| Hazard | Risk Level |
|---|---|
| Earthquake | Medium (4) |
* Risk, particularly concerning flood or landslide, may not be for the entire area.
Recent Nearby Earthquakes
Magnitude 3.0 and greater
| Date▼ | Time↕ | Magnitude↕ | Distance↕ | Depth↕ | Location↕ | Link |
|---|---|---|---|---|---|---|
| 5/1/15 | 6:43 PM | 3.3 | 82.3 km | 20,700 m | 4km SSW of Braga, Portugal | usgs.gov |
| 10/24/10 | 4:42 PM | 3.1 | 16.6 km | 10,000 m | Spain | usgs.gov |
| 2/25/08 | 7:29 AM | 3.5 | 60.4 km | 5,100 m | Spain | usgs.gov |
| 4/2/06 | 5:39 AM | 3.2 | 55 km | 10,600 m | Spain | usgs.gov |
| 7/25/04 | 1:54 AM | 3.4 | 50.1 km | 15,600 m | Spain | usgs.gov |
| 5/23/04 | 5:40 PM | 3.6 | 80.8 km | 10,300 m | Spain | usgs.gov |
| 4/5/03 | 2:53 AM | 3.1 | 47.3 km | 10,000 m | Spain | usgs.gov |
| 12/27/02 | 3:55 PM | 3.1 | 21.7 km | 11,200 m | Spain | usgs.gov |
| 12/2/02 | 3:08 AM | 3.1 | 51.5 km | — | Spain | usgs.gov |
| 3/16/02 | 8:27 PM | 3.3 | 97.6 km | 10,700 m | Spain | usgs.gov |
Showing 1-10 of 54
…
Source: U.S. Geological Survey (USGS)
About Our Data
The data on this page is estimated using a number of publicly available tools and resources. It is provided without warranty, and could contain inaccuracies. Use at your own risk.