Postal Code 41702 - Spain
Spain
| Area of Postal Code 41702 | 22.1 km² |
| Population | 26,106 |
| Male Population | 12,891 (49.4%) |
| Female Population | 13,215 (50.6%) |
| Population change from 1975 to 2015 | -26.5% |
| Population change from 2000 to 2015 | -3.8% |
| Median Age | 36.4 years |
| Male Median Age | 35.7 years |
| Female Median Age | 37 years |
| Timezone | Central European Summer Time |
| Coordinates | 37.251772006806° / -5.914178722075608° |
| Related Postal Codes | 41700, 41701, 41703, 41704, 41710, 41719, 41720, 41727, 41728, 41729 |
Map of Postal Code 41702 - Spain
Interactive Map
Postal Code 41702 - Spain Population
Years 1975 to 2020
| Data | 1975 | 1990 | 2000 | 2015 | 2020 |
|---|---|---|---|---|---|
| Population | 35,541 | 32,913 | 27,136 | 26,106 | 26,747 |
| Population Density | 1,606.1 / km² | 1,487.4 / km² | 1,226.3 / km² | 1,179.8 / km² | 1,208.7 / km² |
Sources: JRC (European Commission's Joint Research Centre) work on the GHS built-up grid
Postal Code 41702 - Spain Population change from 2000 to 2015
Decrease of 3.8% from year 2000 to 2015
| Location | Change since 1975 | Change since 1990 | Change since 2000 |
|---|---|---|---|
| Postal Code 41702 - Spain | -26.5% | -20.7% | -3.8% |
| Spain | +28.4% | +17.7% | +13.2% |
Sources: JRC (European Commission's Joint Research Centre) work on the GHS built-up grid
Postal Code 41702 - Spain Median Age
Median Age: 36.4 years
| Location | Median Age | Median Age (Female) | Median Age (Male) |
|---|---|---|---|
| Postal Code 41702 - Spain | 36.4 yrs | 37 yrs | 35.7 yrs |
| Spain | 40.9 yrs | 42 yrs | 39.7 yrs |
Sources: CIESIN (Center for International Earth Science Information Network)
Postal Code 41702 Population Density
Population Density: 1,180 / km²
| Location | Population | Area | Density |
|---|---|---|---|
| Postal Code 41702 | 26,106 | 22.1 km² | 1,180 / km² |
| Spain | 45.3 million | 505,993.5 km² | 89.5 / km² |
Sources: JRC (European Commission's Joint Research Centre) work on the GHS built-up grid
Postal Code 41702 - Spain Historical and Projected Population
Estimated Population from 0 to 2100
Sources:
- JRC (European Commission's Joint Research Centre) work on the GHS built-up grid
- CIESIN (Center for International Earth Science Information Network)
- [Link] Klein Goldewijk, K., Beusen, A., Doelman, J., and Stehfest, E.: Anthropogenic land use estimates for the Holocene – HYDE 3.2, Earth Syst. Sci. Data, 9, 927–953, https://doi.org/10.5194/essd-9-927-2017, 2017.
Area Codes
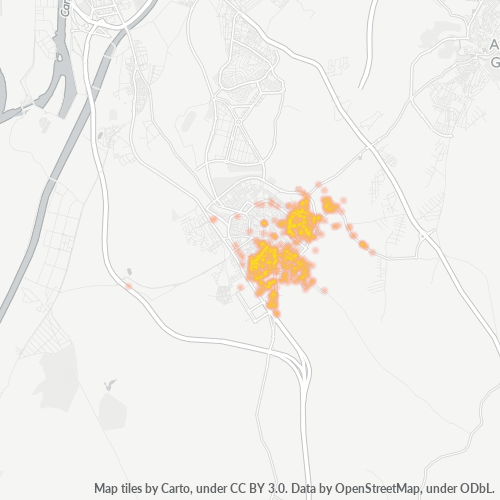
Percentage Area Codes used by businesses in Postal Code 41702 - Spain
Business Concentration in Postal Code 41702 - Spain
Industries
Business Distribution by Industry in Postal Code 41702 - Spain
| Industry Description | Number of Establishments |
|---|---|
| All food and beverage | 27 |
| Bakeries | 35 |
| Bars, pubs and taverns | 96 |
| Beauty salons | 49 |
| Cafes | 42 |
| Car repair | 78 |
| Clothing stores | 31 |
| Construction of buildings | 31 |
| Corporate management | 44 |
| Education | 44 |
| Grocery stores and supermarkets | 44 |
| Hairdressers | 29 |
| Real estate | 41 |
| Restaurants | 73 |
| Shopping | 112 |
| Shopping other | 33 |
Business distribution by price for Postal Code 41702 - Spain
Human Development Index (HDI)
Statistic composite index of life expectancy, education, and per capita income.
Source: [Link] Kummu, M., Taka, M. &Guillaume, J. Gridded global datasets for Gross Domestic Product and Human Development Index over 1990–2015. Sci Data 5, 180004 (2018) doi:10.1038/sdata.2018.4
Postal Code 41702 CO2 Emissions
Carbon Dioxide (CO2) Emissions Per Capita in Tonnes Per Year
| Location | CO2 Emissions | CO2 Emissions Per Capita | CO2 Emissions Intensity |
|---|---|---|---|
| Postal Code 41702 | 180,470 tn | 6.91 tn | 8,155.6 tons/km² |
| Spain | 330,097,501 tn | 7.29 tn | 652.4 tons/km² |
Sources: [Link] Moran, D., Kanemoto K; Jiborn, M., Wood, R., Többen, J., and Seto, K.C. (2018) Carbon footprints of 13,000 cities. Environmental Research Letters DOI: 10.1088/1748-9326/aac72a
Postal Code 41702 CO2 Emissions
| 2013 CO2 emissions (tonnes/year) | 180,470 tn |
| 2013 CO2 emissions (tonnes/year) per capita | 6.91 tn |
| 2013 CO2 emissions intensity (tonnes/km²/year) | 8,155.6 tons/km² |
Natural Hazards Risk
Relative risk out of 10
| Hazard | Risk Level |
|---|---|
| Drought | High (10) |
| Earthquake | Medium (4) |
* Risk, particularly concerning flood or landslide, may not be for the entire area.
Recent Nearby Earthquakes
Magnitude 3.0 and greater
| Date▼ | Time↕ | Magnitude↕ | Distance↕ | Depth↕ | Location↕ | Link |
|---|---|---|---|---|---|---|
| 4/26/18 | 4:13 AM | 4 | 89.3 km | 10,000 m | 9km SW of Cortes de la Frontera, Spain | usgs.gov |
| 8/19/14 | 6:38 AM | 4.6 | 47.5 km | 11,330 m | 1km WNW of Puerto Serrano, Spain | usgs.gov |
| 3/18/13 | 8:11 PM | 4 | 93.6 km | 44,600 m | Strait of Gibraltar | usgs.gov |
| 11/25/08 | 4:27 AM | 3.1 | 49.8 km | 10,100 m | Spain | usgs.gov |
| 11/23/08 | 6:40 AM | 3.3 | 48.2 km | 10,800 m | Spain | usgs.gov |
| 10/14/08 | 2:06 AM | 3.1 | 49.3 km | — | Spain | usgs.gov |
| 10/8/08 | 3:49 PM | 3.1 | 42.8 km | 5,000 m | Spain | usgs.gov |
| 10/8/08 | 9:04 AM | 3.9 | 48.3 km | 11,100 m | Spain | usgs.gov |
| 10/6/08 | 1:17 PM | 3.1 | 48.9 km | 10,700 m | Spain | usgs.gov |
| 10/4/08 | 2:50 AM | 3.1 | 47.7 km | 7,700 m | Spain | usgs.gov |
Showing 1-10 of 105
…
Source: U.S. Geological Survey (USGS)
About Our Data
The data on this page is estimated using a number of publicly available tools and resources. It is provided without warranty, and could contain inaccuracies. Use at your own risk.