Postal Code CB3 - United Kingdom
United Kingdom
| Area of Postal Code CB3 | 18.3 km² |
| Population | 19,846 |
| Male Population | 10,196 (51.4%) |
| Female Population | 9,650 (48.6%) |
| Population change from 1975 to 2015 | +50.0% |
| Population change from 2000 to 2015 | +19.5% |
| Median Age | 25.2 years |
| Male Median Age | 24.8 years |
| Female Median Age | 25.7 years |
| Area Codes | 1223 |
| Postal Code Extensions | CB3 0AA, CB3 0AB, CB3 0AD, CB3 0AE, CB3 0AF, CB3 0AG, CB3 0AH, CB3 0AJ, CB3 0AL, CB3 0AN More |
| Associated Cities | Cambridge, Huntingdon, Girton, Cambridgeshire, Swavesey |
| Neighborhoods | Cambridge, Girton, Grantchester |
| Timezone | British Summer Time |
| Coordinates | 52.21203613997441° / 0.051436249015144105° |
| Related Postal Codes | CB1, CB2, CB24, CB25, CB4, CB5, CB6, CB7, CB8, CB9 |
Map of Postal Code CB3 - United Kingdom
Interactive Map
Postal Code CB3 - United Kingdom Population
Years 1975 to 2020
| Data | 1975 | 1990 | 2000 | 2015 | 2020 |
|---|---|---|---|---|---|
| Population | 13,227 | 15,114 | 16,611 | 19,846 | 19,929 |
| Population Density | 723.5 / km² | 826.7 / km² | 908.6 / km² | 1,085.6 / km² | 1,090.1 / km² |
Sources: JRC (European Commission's Joint Research Centre) work on the GHS built-up grid
Postal Code CB3 - United Kingdom Population change from 2000 to 2015
Increase of 19.5% from year 2000 to 2015
| Location | Change since 1975 | Change since 1990 | Change since 2000 |
|---|---|---|---|
| Postal Code CB3 - United Kingdom | +50% | +31.3% | +19.5% |
| United Kingdom | +15.2% | +13.3% | +9.9% |
Sources: JRC (European Commission's Joint Research Centre) work on the GHS built-up grid
Postal Code CB3 - United Kingdom Median Age
Median Age: 25.2 years
| Location | Median Age | Median Age (Female) | Median Age (Male) |
|---|---|---|---|
| Postal Code CB3 - United Kingdom | 25.2 yrs | 25.7 yrs | 24.8 yrs |
| United Kingdom | 39.6 yrs | 40.6 yrs | 38.5 yrs |
Sources: CIESIN (Center for International Earth Science Information Network)
Postal Code CB3 Population Density
Population Density: 1,086 / km²
| Location | Population | Area | Density |
|---|---|---|---|
| Postal Code CB3 | 19,846 | 18.3 km² | 1,086 / km² |
| United Kingdom | 64.5 million | 247,916.6 km² | 260 / km² |
Sources: JRC (European Commission's Joint Research Centre) work on the GHS built-up grid
Postal Code CB3 - United Kingdom Historical and Projected Population
Estimated Population from 1710 to 2100
Sources:
- JRC (European Commission's Joint Research Centre) work on the GHS built-up grid
- CIESIN (Center for International Earth Science Information Network)
- [Link] Klein Goldewijk, K., Beusen, A., Doelman, J., and Stehfest, E.: Anthropogenic land use estimates for the Holocene – HYDE 3.2, Earth Syst. Sci. Data, 9, 927–953, https://doi.org/10.5194/essd-9-927-2017, 2017.
Neighborhoods
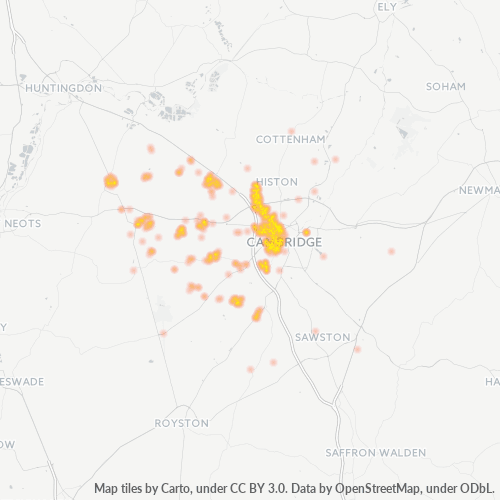
Business Distribution by neighborhood in Postal Code CB3 - United Kingdom
Business Concentration in Postal Code CB3 - United Kingdom
Industries
Business Distribution by Industry in Postal Code CB3 - United Kingdom
| Industry Description | Number of Establishments | Average Age of Business |
|---|---|---|
| Construction of buildings | 39 | — |
| Corporate management | 113 | 23.4 years |
| Education | 69 | 46.6 years |
| Electronics stores | 75 | 34.9 years |
| Higher education (colleges and universities) | 86 | 67 years |
| Other accommodation | 67 | — |
| Real estate | 43 | 22.4 years |
| Religion | 40 | 54.2 years |
| Research, development and testing services | 40 | 34.9 years |
| Restaurants | 55 | 24.6 years |
| Shopping | 50 | 26.6 years |
| Shopping other | 63 | — |
Business distribution by price for Postal Code CB3 - United Kingdom
Human Development Index (HDI)
Statistic composite index of life expectancy, education, and per capita income.
Source: [Link] Kummu, M., Taka, M. &Guillaume, J. Gridded global datasets for Gross Domestic Product and Human Development Index over 1990–2015. Sci Data 5, 180004 (2018) doi:10.1038/sdata.2018.4
Postal Code CB3 CO2 Emissions
Carbon Dioxide (CO2) Emissions Per Capita in Tonnes Per Year
| Location | CO2 Emissions | CO2 Emissions Per Capita | CO2 Emissions Intensity |
|---|---|---|---|
| Postal Code CB3 | 239,324 tn | 12.06 tn | 13,090.9 tons/km² |
| United Kingdom | 735,672,544 tn | 11.4 tn | 2,967.4 tons/km² |
Sources: [Link] Moran, D., Kanemoto K; Jiborn, M., Wood, R., Többen, J., and Seto, K.C. (2018) Carbon footprints of 13,000 cities. Environmental Research Letters DOI: 10.1088/1748-9326/aac72a
Postal Code CB3 CO2 Emissions
| 2013 CO2 emissions (tonnes/year) | 239,324 tn |
| 2013 CO2 emissions (tonnes/year) per capita | 12.06 tn |
| 2013 CO2 emissions intensity (tonnes/km²/year) | 13,090.9 tons/km² |
Natural Hazards Risk
Relative risk out of 10
| Hazard | Risk Level |
|---|---|
| Flood | High (9) |
* Risk, particularly concerning flood or landslide, may not be for the entire area.
Recent Nearby Earthquakes
Magnitude 3.0 and greater
| Date▼ | Time↕ | Magnitude↕ | Distance↕ | Depth↕ | Location↕ | Link |
|---|---|---|---|---|---|---|
| 1/28/15 | 2:25 PM | 3.8 | 77.5 km | 3,000 m | 1km N of Ashwell, United Kingdom | usgs.gov |
| 4/17/14 | 11:50 PM | 3.5 | 77.8 km | 2,000 m | 1km NW of Ashwell, United Kingdom | usgs.gov |
| 10/28/01 | 8:25 AM | 4.2 | 93.6 km | 11,600 m | England, United Kingdom | usgs.gov |
| 1/21/99 | 3:10 AM | 3.3 | 92.7 km | 10,000 m | England, United Kingdom | usgs.gov |
| 2/15/94 | 2:15 AM | 4.4 | 57.3 km | 10,000 m | England, United Kingdom | usgs.gov |
| 2/16/92 | 5:22 PM | 3.4 | 23.6 km | 10,000 m | England, United Kingdom | usgs.gov |
| 4/30/87 | 11:09 PM | 3.4 | 72.2 km | 10,000 m | England, United Kingdom | usgs.gov |
| 5/29/84 | 7:53 PM | 3.4 | 94.5 km | 10,000 m | England, United Kingdom | usgs.gov |
Source: U.S. Geological Survey (USGS)
Postal Code Extensions (1,444)
About Our Data
The data on this page is estimated using a number of publicly available tools and resources. It is provided without warranty, and could contain inaccuracies. Use at your own risk.