Postal Code DH2 - United Kingdom
United Kingdom
| Area of Postal Code DH2 | 26.7 km² |
| Population | 31,319 |
| Male Population | 15,201 (48.5%) |
| Female Population | 16,118 (51.5%) |
| Population change from 1975 to 2015 | +1.7% |
| Population change from 2000 to 2015 | +3.9% |
| Median Age | 43.3 years |
| Male Median Age | 42.6 years |
| Female Median Age | 44 years |
| Area Codes | 191 |
| Postal Code Extensions | DH2 1AA, DH2 1AB, DH2 1AD, DH2 1AE, DH2 1AF, DH2 1AG, DH2 1AH, DH2 1AJ, DH2 1AL, DH2 1AN More |
| Associated Cities | Durham, Chester-le-Street, Pelton, County Durham, Sacriston |
| Neighborhoods | Birtley, Chester Moor, Chester-le-Street, Drum Industrial Estate, Grange Villa, Ouston, Pelton, Pelton Fell, Waldridge |
| Timezone | British Summer Time |
| Coordinates | 54.858666096587534° / -1.5958559205287735° |
| Related Postal Codes | DH1, DH3, DH4, DH5, DH6, DH7, DH8, DH9, DH97, DH98 |
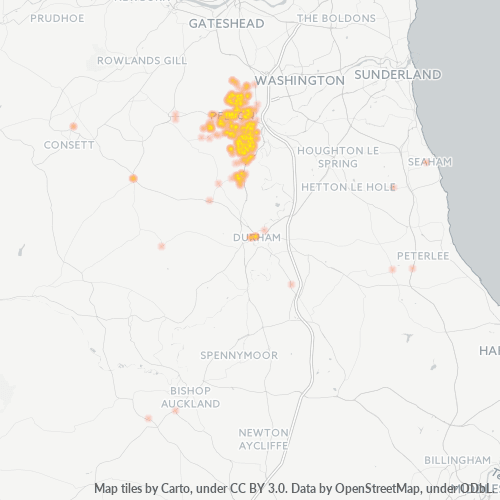
Map of Postal Code DH2 - United Kingdom
Interactive Map
Postal Code DH2 - United Kingdom Population
Years 1975 to 2020
| Data | 1975 | 1990 | 2000 | 2015 | 2020 |
|---|---|---|---|---|---|
| Population | 30,797 | 30,101 | 30,135 | 31,319 | 32,866 |
| Population Density | 1,152.2 / km² | 1,126.2 / km² | 1,127.4 / km² | 1,171.7 / km² | 1,229.6 / km² |
Sources: JRC (European Commission's Joint Research Centre) work on the GHS built-up grid
Postal Code DH2 - United Kingdom Population change from 2000 to 2015
Increase of 3.9% from year 2000 to 2015
| Location | Change since 1975 | Change since 1990 | Change since 2000 |
|---|---|---|---|
| Postal Code DH2 - United Kingdom | +1.7% | +4% | +3.9% |
| United Kingdom | +15.2% | +13.3% | +9.9% |
Sources: JRC (European Commission's Joint Research Centre) work on the GHS built-up grid
Postal Code DH2 - United Kingdom Median Age
Median Age: 43.3 years
| Location | Median Age | Median Age (Female) | Median Age (Male) |
|---|---|---|---|
| Postal Code DH2 - United Kingdom | 43.3 yrs | 44 yrs | 42.6 yrs |
| United Kingdom | 39.6 yrs | 40.6 yrs | 38.5 yrs |
Sources: CIESIN (Center for International Earth Science Information Network)
Postal Code DH2 Population Density
Population Density: 1,172 / km²
| Location | Population | Area | Density |
|---|---|---|---|
| Postal Code DH2 | 31,319 | 26.7 km² | 1,172 / km² |
| United Kingdom | 64.5 million | 247,916.6 km² | 260 / km² |
Sources: JRC (European Commission's Joint Research Centre) work on the GHS built-up grid
Postal Code DH2 - United Kingdom Historical and Projected Population
Estimated Population from 1000 to 2100
Sources:
- JRC (European Commission's Joint Research Centre) work on the GHS built-up grid
- CIESIN (Center for International Earth Science Information Network)
- [Link] Klein Goldewijk, K., Beusen, A., Doelman, J., and Stehfest, E.: Anthropogenic land use estimates for the Holocene – HYDE 3.2, Earth Syst. Sci. Data, 9, 927–953, https://doi.org/10.5194/essd-9-927-2017, 2017.
Neighborhoods
Business Distribution by neighborhood in Postal Code DH2 - United Kingdom
Area Codes
Percentage Area Codes used by businesses in Postal Code DH2 - United Kingdom
Business Concentration in Postal Code DH2 - United Kingdom
Industries
Business Distribution by Industry in Postal Code DH2 - United Kingdom
| Industry Description | Number of Establishments | Average Age of Business |
|---|---|---|
| Beauty salons | 36 | — |
| Buses and trains | 31 | — |
| Car repair | 49 | 22.1 years |
| Construction of buildings | 48 | 20.5 years |
| Corporate management | 56 | 22.4 years |
| Driving schools | 32 | — |
| Electrical installation | 43 | 24.8 years |
| General contractors | 59 | — |
| Other construction | 31 | — |
| Restaurants | 44 | — |
| Shopping | 48 | 25.4 years |
| Shopping other | 47 | 24.2 years |
| Specialized design | 28 | — |
| Taxis | 65 | — |
| Technical construction services | 29 | 28.5 years |
| Wholesale of construction supplies | 30 | 26.1 years |
| Wholesale of machinery | 34 | 18.2 years |
Business distribution by price for Postal Code DH2 - United Kingdom
Human Development Index (HDI)
Statistic composite index of life expectancy, education, and per capita income.
Source: [Link] Kummu, M., Taka, M. &Guillaume, J. Gridded global datasets for Gross Domestic Product and Human Development Index over 1990–2015. Sci Data 5, 180004 (2018) doi:10.1038/sdata.2018.4
Postal Code DH2 CO2 Emissions
Carbon Dioxide (CO2) Emissions Per Capita in Tonnes Per Year
| Location | CO2 Emissions | CO2 Emissions Per Capita | CO2 Emissions Intensity |
|---|---|---|---|
| Postal Code DH2 | 8,128 tn | 0.26 tn | 304.1 tons/km² |
| United Kingdom | 735,672,544 tn | 11.4 tn | 2,967.4 tons/km² |
Sources: [Link] Moran, D., Kanemoto K; Jiborn, M., Wood, R., Többen, J., and Seto, K.C. (2018) Carbon footprints of 13,000 cities. Environmental Research Letters DOI: 10.1088/1748-9326/aac72a
Postal Code DH2 CO2 Emissions
| 2013 CO2 emissions (tonnes/year) | 8,128 tn |
| 2013 CO2 emissions (tonnes/year) per capita | 0.26 tn |
| 2013 CO2 emissions intensity (tonnes/km²/year) | 304.1 tons/km² |
Natural Hazards Risk
Relative risk out of 10
| Hazard | Risk Level |
|---|---|
| Flood | High (8) |
* Risk, particularly concerning flood or landslide, may not be for the entire area.
Recent Nearby Earthquakes
Magnitude 3.0 and greater
| Date▼ | Time↕ | Magnitude↕ | Distance↕ | Depth↕ | Location↕ | Link |
|---|---|---|---|---|---|---|
| 1/3/11 | 1:03 PM | 3.6 | 76.9 km | 6,000 m | England, United Kingdom | usgs.gov |
| 9/12/88 | 7:23 AM | 3.7 | 86.8 km | 10,000 m | England, United Kingdom | usgs.gov |
| 12/25/79 | 7:57 PM | 4.5 | 70 km | 10,000 m | England, United Kingdom | usgs.gov |
Source: U.S. Geological Survey (USGS)
Postal Code Extensions (855)
About Our Data
The data on this page is estimated using a number of publicly available tools and resources. It is provided without warranty, and could contain inaccuracies. Use at your own risk.