Postal Code IP5 - United Kingdom
United Kingdom
| Area of Postal Code IP5 | 13 km² |
| Population | 20,021 |
| Male Population | 9,827 (49.1%) |
| Female Population | 10,194 (50.9%) |
| Population change from 1975 to 2015 | +20.7% |
| Population change from 2000 to 2015 | +10.1% |
| Median Age | 42.2 years |
| Male Median Age | 41.5 years |
| Female Median Age | 42.9 years |
| Area Codes | 1473 |
| Postal Code Extensions | IP5 1AA, IP5 1AB, IP5 1AD, IP5 1AE, IP5 1AF, IP5 1AG, IP5 1AH, IP5 1AJ, IP5 1AL, IP5 1AN More |
| Associated Cities | Ipswich, Kesgrave, Playford, Suffolk, Martlesham |
| Neighborhoods | Kesgrave, Martlesham, Rushmere Saint Andrew |
| Timezone | British Summer Time |
| Coordinates | 52.06200537441781° / 1.2422499578125845° |
| Related Postal Codes | IP26, IP27, IP28, IP3, IP33, IP4, IP6, IP7, IP8, IP9 |
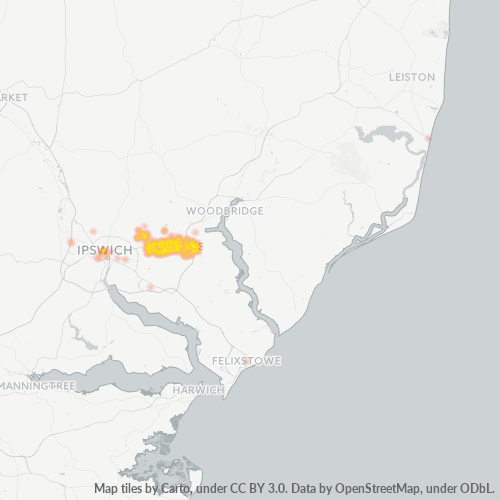
Map of Postal Code IP5 - United Kingdom
Interactive Map
Postal Code IP5 - United Kingdom Population
Years 1975 to 2020
| Data | 1975 | 1990 | 2000 | 2015 | 2020 |
|---|---|---|---|---|---|
| Population | 16,594 | 17,220 | 18,178 | 20,021 | 20,920 |
| Population Density | 1,277.4 / km² | 1,325.5 / km² | 1,399.3 / km² | 1,541.2 / km² | 1,610.4 / km² |
Sources: JRC (European Commission's Joint Research Centre) work on the GHS built-up grid
Postal Code IP5 - United Kingdom Population change from 2000 to 2015
Increase of 10.1% from year 2000 to 2015
| Location | Change since 1975 | Change since 1990 | Change since 2000 |
|---|---|---|---|
| Postal Code IP5 - United Kingdom | +20.7% | +16.3% | +10.1% |
| United Kingdom | +15.2% | +13.3% | +9.9% |
Sources: JRC (European Commission's Joint Research Centre) work on the GHS built-up grid
Postal Code IP5 - United Kingdom Median Age
Median Age: 42.2 years
| Location | Median Age | Median Age (Female) | Median Age (Male) |
|---|---|---|---|
| Postal Code IP5 - United Kingdom | 42.2 yrs | 42.9 yrs | 41.5 yrs |
| United Kingdom | 39.6 yrs | 40.6 yrs | 38.5 yrs |
Sources: CIESIN (Center for International Earth Science Information Network)
Postal Code IP5 Population Density
Population Density: 1,541 / km²
| Location | Population | Area | Density |
|---|---|---|---|
| Postal Code IP5 | 20,021 | 13 km² | 1,541 / km² |
| United Kingdom | 64.5 million | 247,916.6 km² | 260 / km² |
Sources: JRC (European Commission's Joint Research Centre) work on the GHS built-up grid
Postal Code IP5 - United Kingdom Historical and Projected Population
Estimated Population from 1200 to 2100
Sources:
- JRC (European Commission's Joint Research Centre) work on the GHS built-up grid
- CIESIN (Center for International Earth Science Information Network)
- [Link] Klein Goldewijk, K., Beusen, A., Doelman, J., and Stehfest, E.: Anthropogenic land use estimates for the Holocene – HYDE 3.2, Earth Syst. Sci. Data, 9, 927–953, https://doi.org/10.5194/essd-9-927-2017, 2017.
Neighborhoods
Business Distribution by neighborhood in Postal Code IP5 - United Kingdom
Area Codes
Percentage Area Codes used by businesses in Postal Code IP5 - United Kingdom
Business Concentration in Postal Code IP5 - United Kingdom
Industries
Business Distribution by Industry in Postal Code IP5 - United Kingdom
| Industry Description | Number of Establishments | Average Age of Business |
|---|---|---|
| Accountants | 34 | 24.7 years |
| Beauty salons | 34 | — |
| Car repair | 35 | — |
| Construction of buildings | 34 | 28.1 years |
| Corporate management | 70 | 22.4 years |
| Electrical installation | 32 | 23.4 years |
| Electronics stores | 57 | 26.2 years |
| General contractors | 26 | 22.5 years |
| Real estate | 29 | 24 years |
| Shopping | 70 | 24.5 years |
| Shopping other | 28 | 33.7 years |
| Wholesale of machinery | 26 | 29.1 years |
Business distribution by price for Postal Code IP5 - United Kingdom
Human Development Index (HDI)
Statistic composite index of life expectancy, education, and per capita income.
Source: [Link] Kummu, M., Taka, M. &Guillaume, J. Gridded global datasets for Gross Domestic Product and Human Development Index over 1990–2015. Sci Data 5, 180004 (2018) doi:10.1038/sdata.2018.4
Postal Code IP5 CO2 Emissions
Carbon Dioxide (CO2) Emissions Per Capita in Tonnes Per Year
| Location | CO2 Emissions | CO2 Emissions Per Capita | CO2 Emissions Intensity |
|---|---|---|---|
| Postal Code IP5 | 248,557 tn | 12.41 tn | 19,133.3 tons/km² |
| United Kingdom | 735,672,544 tn | 11.4 tn | 2,967.4 tons/km² |
Sources: [Link] Moran, D., Kanemoto K; Jiborn, M., Wood, R., Többen, J., and Seto, K.C. (2018) Carbon footprints of 13,000 cities. Environmental Research Letters DOI: 10.1088/1748-9326/aac72a
Postal Code IP5 CO2 Emissions
| 2013 CO2 emissions (tonnes/year) | 248,557 tn |
| 2013 CO2 emissions (tonnes/year) per capita | 12.41 tn |
| 2013 CO2 emissions intensity (tonnes/km²/year) | 19,133.3 tons/km² |
Natural Hazards Risk
Relative risk out of 10
| Hazard | Risk Level |
|---|---|
| Flood | Medium (4) |
* Risk, particularly concerning flood or landslide, may not be for the entire area.
Recent Nearby Earthquakes
Magnitude 3.0 and greater
| Date▼ | Time↕ | Magnitude↕ | Distance↕ | Depth↕ | Location↕ | Link |
|---|---|---|---|---|---|---|
| 5/21/15 | 6:52 PM | 3.7 | 85.4 km | 12,000 m | 3km SSE of Ramsgate, United Kingdom | usgs.gov |
| 1/23/07 | 9:32 AM | 4.1 | 76.9 km | 10,000 m | North Sea | usgs.gov |
| 9/14/94 | 11:36 PM | 3.9 | 61.2 km | 10,000 m | England, United Kingdom | usgs.gov |
| 2/15/94 | 2:15 AM | 4.4 | 44.3 km | 10,000 m | England, United Kingdom | usgs.gov |
| 2/16/92 | 5:22 PM | 3.4 | 98.9 km | 10,000 m | England, United Kingdom | usgs.gov |
| 4/15/85 | 11:02 AM | 3.4 | 77.5 km | 10,000 m | England, United Kingdom | usgs.gov |
Source: U.S. Geological Survey (USGS)
Postal Code Extensions (877)
About Our Data
The data on this page is estimated using a number of publicly available tools and resources. It is provided without warranty, and could contain inaccuracies. Use at your own risk.