Postal Code KA2 - United Kingdom
| Area of Postal Code KA2 | 37.4 km² |
| Population | 7,889 |
| Male Population | 3,832 (48.6%) |
| Female Population | 4,057 (51.4%) |
| Population change from 1975 to 2015 | -7.0% |
| Population change from 2000 to 2015 | +1.1% |
| Median Age | 43.4 years |
| Male Median Age | 42.5 years |
| Female Median Age | 44.2 years |
| Area Codes | 1292, 1563 |
| Postal Code Extensions | KA2 0AA, KA2 0AB, KA2 0AD, KA2 0AE, KA2 0AF, KA2 0AG, KA2 0AH, KA2 0AJ, KA2 0AL, KA2 0AN More |
| Associated Cities | Ayr, Kilmarnock, Irvine, North Ayrshire, Crosshouse |
| Neighborhoods | Crosshouse, Dundonald, Gatehead, Knockentiber |
| Timezone | British Summer Time |
| Coordinates | 55.60285486865196° / -4.555981715351047° |
| Related Postal Codes | KA20, KA21, KA22, KA23, KA24, KA25, KA26, KA27, KA28, KA29 |
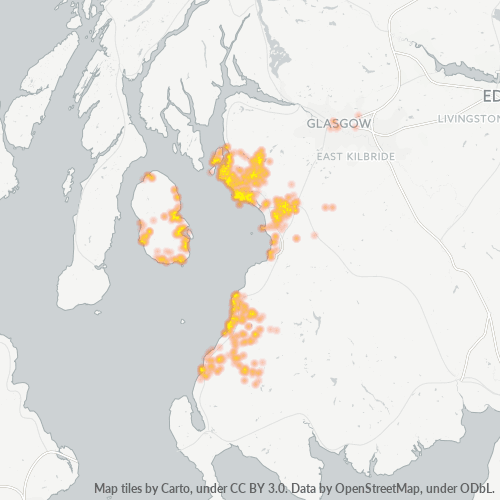
Map of Postal Code KA2 - United Kingdom
Interactive Map
Postal Code KA2 - United Kingdom Population
Years 1975 to 2020
| Data | 1975 | 1990 | 2000 | 2015 | 2020 |
|---|---|---|---|---|---|
| Population | 8,482 | 8,000 | 7,804 | 7,889 | 8,266 |
| Population Density | 227 / km² | 214.1 / km² | 208.9 / km² | 211.1 / km² | 221.2 / km² |
Postal Code KA2 - United Kingdom Population change from 2000 to 2015
Increase of 1.1% from year 2000 to 2015
| Location | Change since 1975 | Change since 1990 | Change since 2000 |
|---|---|---|---|
| Postal Code KA2 - United Kingdom | -7% | -1.4% | +1.1% |
| United Kingdom | +15.2% | +13.3% | +9.9% |
Postal Code KA2 - United Kingdom Median Age
Median Age: 43.4 years
| Location | Median Age | Median Age (Female) | Median Age (Male) |
|---|---|---|---|
| Postal Code KA2 - United Kingdom | 43.4 yrs | 44.2 yrs | 42.5 yrs |
| United Kingdom | 39.6 yrs | 40.6 yrs | 38.5 yrs |
Postal Code KA2 Population Density
Population Density: 211 / km²
| Location | Population | Area | Density |
|---|---|---|---|
| Postal Code KA2 | 7,889 | 37.4 km² | 211 / km² |
| United Kingdom | 64.5 million | 247,916.6 km² | 260 / km² |
Postal Code KA2 - United Kingdom Historical and Projected Population
Estimated Population from 1200 to 2100
- JRC (European Commission's Joint Research Centre) work on the GHS built-up grid
- CIESIN (Center for International Earth Science Information Network)
- [Link] Klein Goldewijk, K., Beusen, A., Doelman, J., and Stehfest, E.: Anthropogenic land use estimates for the Holocene – HYDE 3.2, Earth Syst. Sci. Data, 9, 927–953, https://doi.org/10.5194/essd-9-927-2017, 2017.
Neighborhoods
Business Distribution by neighborhood in Postal Code KA2 - United Kingdom
Area Codes
Percentage Area Codes used by businesses in Postal Code KA2 - United Kingdom
Industries
Business Distribution by Industry in Postal Code KA2 - United Kingdom
| Industry Description | Number of Establishments | Average Age of Business |
|---|---|---|
| All food and beverage | 10 | — |
| Bars, pubs and taverns | 9 | — |
| Car repair | 22 | 18.2 years |
| Construction of buildings | 10 | — |
| Corporate management | 30 | 29 years |
| Driving schools | 13 | — |
| Education | 9 | — |
| Education other | 11 | — |
| Electrical installation | 9 | — |
| General contractors | 15 | — |
| Grocery stores and supermarkets | 10 | — |
| Health and medical | 11 | — |
| Hospitals | 13 | — |
| Restaurants | 13 | — |
| Roofing contractor | 9 | — |
| Shopping | 22 | — |
| Shopping other | 37 | 25.3 years |
| Technical construction services | 9 | — |
| Tractors and farm equipment | 25 | — |
| Wholesale of construction supplies | 14 | — |
Business distribution by price for Postal Code KA2 - United Kingdom
Human Development Index (HDI)
Statistic composite index of life expectancy, education, and per capita income.
Postal Code KA2 CO2 Emissions
Carbon Dioxide (CO2) Emissions Per Capita in Tonnes Per Year
| Location | CO2 Emissions | CO2 Emissions Per Capita | CO2 Emissions Intensity |
|---|---|---|---|
| Postal Code KA2 | 94,085 tn | 11.93 tn | 2,518 tons/km² |
| United Kingdom | 735,672,544 tn | 11.4 tn | 2,967.4 tons/km² |
| 2013 CO2 emissions (tonnes/year) | 94,085 tn |
| 2013 CO2 emissions (tonnes/year) per capita | 11.93 tn |
| 2013 CO2 emissions intensity (tonnes/km²/year) | 2,518 tons/km² |
Recent Nearby Earthquakes
Magnitude 3.0 and greater
| Date▼ | Time↕ | Magnitude↕ | Distance↕ | Depth↕ | Location↕ | Link |
|---|---|---|---|---|---|---|
| 12/26/06 | 2:40 AM | 3.6 | 82.1 km | 7,700 m | Scotland, United Kingdom | usgs.gov |
Cities
Percentage of businesses by city in Postal Code KA2 - United Kingdom
About Our Data
The data on this page is estimated using a number of publicly available tools and resources. It is provided without warranty, and could contain inaccuracies. Use at your own risk.