Postal Code 11000 - Montevideo Department
Montevideo Department | Uruguay
| Area of Postal Code 11000 | 1.627 km² |
| Population | 9,944 |
| Male Population | 4,712 (47.4%) |
| Female Population | 5,232 (52.6%) |
| Population change from 1975 to 2015 | +25.1% |
| Population change from 2000 to 2015 | -3.8% |
| Median Age | 36 years |
| Male Median Age | 35.5 years |
| Female Median Age | 36.5 years |
| Associated Cities | Montevideo |
| Neighborhoods | Centro, Ciudad Veja, Ciudad Vieja |
| Timezone | Uruguay Standard Time |
| Coordinates | -34.90647137887521° / -56.208436630192615° |
| Related Postal Codes | 11100, 11200, 11300, 11400, 11500, 11600, 11700, 11800, 11900, 12000 |
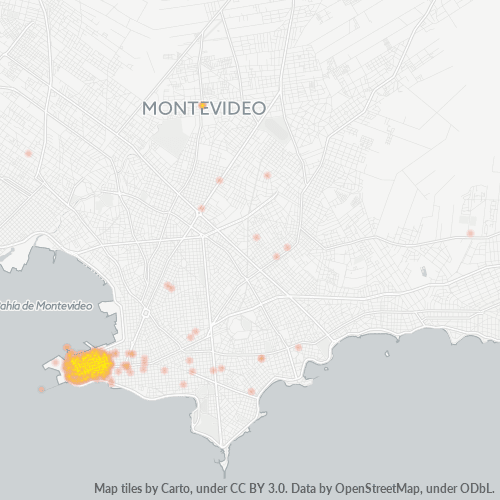
Map of Postal Code 11000 - Montevideo Department
Interactive Map
Postal Code 11000 - Montevideo Department Population
Years 1975 to 2020
| Data | 1975 | 1990 | 2000 | 2015 | 2020 |
|---|---|---|---|---|---|
| Population | 7,952 | 9,907 | 10,334 | 9,944 | 10,054 |
| Population Density | 4,888.2 / km² | 6,089.9 / km² | 6,352.4 / km² | 6,112.7 / km² | 6,180.3 / km² |
Sources: JRC (European Commission's Joint Research Centre) work on the GHS built-up grid
Postal Code 11000 - Montevideo Department Population change from 2000 to 2015
Decrease of 3.8% from year 2000 to 2015
| Location | Change since 1975 | Change since 1990 | Change since 2000 |
|---|---|---|---|
| Postal Code 11000 - Montevideo Department | +25.1% | +0.4% | -3.8% |
| Montevideo Department | +36.1% | +5.9% | -0.6% |
| Uruguay | +21.1% | +10.3% | +3.3% |
Sources: JRC (European Commission's Joint Research Centre) work on the GHS built-up grid
Postal Code 11000 - Montevideo Department Median Age
Median Age: 36 years
| Location | Median Age | Median Age (Female) | Median Age (Male) |
|---|---|---|---|
| Postal Code 11000 - Montevideo Department | 36 yrs | 36.5 yrs | 35.5 yrs |
| Montevideo Department | 35.6 yrs | 37.8 yrs | 33.1 yrs |
| Uruguay | 34.5 yrs | 36.1 yrs | 32.7 yrs |
Sources: CIESIN (Center for International Earth Science Information Network)
Postal Code 11000 Population Density
Population Density: 6,113 / km²
| Location | Population | Area | Density |
|---|---|---|---|
| Postal Code 11000 | 9,944 | 1.627 km² | 6,113 / km² |
| Montevideo Department | 1.3 million | 539.8 km² | 2,424 / km² |
| Uruguay | 3.4 million | 177,726.8 km² | 19.2 / km² |
Sources: JRC (European Commission's Joint Research Centre) work on the GHS built-up grid
Postal Code 11000 - Montevideo Department Historical and Projected Population
Estimated Population from 1860 to 2100
Sources:
- JRC (European Commission's Joint Research Centre) work on the GHS built-up grid
- CIESIN (Center for International Earth Science Information Network)
- [Link] Klein Goldewijk, K., Beusen, A., Doelman, J., and Stehfest, E.: Anthropogenic land use estimates for the Holocene – HYDE 3.2, Earth Syst. Sci. Data, 9, 927–953, https://doi.org/10.5194/essd-9-927-2017, 2017.
Neighborhoods
Business Distribution by neighborhood in Postal Code 11000 - Montevideo Department
Business Concentration in Postal Code 11000 - Montevideo Department
Industries
Business Distribution by Industry in Postal Code 11000 - Montevideo Department
| Industry Description | Number of Establishments | Average Age of Business |
|---|---|---|
| Art galleries | 50 | — |
| Banks | 59 | — |
| Clothing stores | 60 | — |
| Corporate management | 213 | — |
| Education | 58 | 35.9 years |
| Electronics stores | 69 | 20.8 years |
| Finance other | 48 | — |
| Grocery stores and supermarkets | 62 | — |
| Lawyers legal | 130 | 42.7 years |
| Museums | 52 | 56.8 years |
| Other accommodation | 49 | — |
| Public administration | 78 | 100.2 years |
| Real estate | 66 | — |
| Restaurants | 243 | 11.7 years |
| Shopping | 196 | — |
Business distribution by price for Postal Code 11000 - Montevideo Department
Human Development Index (HDI)
Statistic composite index of life expectancy, education, and per capita income.
Source: [Link] Kummu, M., Taka, M. &Guillaume, J. Gridded global datasets for Gross Domestic Product and Human Development Index over 1990–2015. Sci Data 5, 180004 (2018) doi:10.1038/sdata.2018.4
Postal Code 11000 CO2 Emissions
Carbon Dioxide (CO2) Emissions Per Capita in Tonnes Per Year
| Location | CO2 Emissions | CO2 Emissions Per Capita | CO2 Emissions Intensity |
|---|---|---|---|
| Postal Code 11000 | 42,995 tn | 4.32 tn | 26,429.4 tons/km² |
| Montevideo Department | 5,762,141 tn | 4.4 tn | 10,675.1 tons/km² |
| Uruguay | 13,592,928 tn | 3.98 tn | 76.5 tons/km² |
Sources: [Link] Moran, D., Kanemoto K; Jiborn, M., Wood, R., Többen, J., and Seto, K.C. (2018) Carbon footprints of 13,000 cities. Environmental Research Letters DOI: 10.1088/1748-9326/aac72a
Postal Code 11000 CO2 Emissions
| 2013 CO2 emissions (tonnes/year) | 42,995 tn |
| 2013 CO2 emissions (tonnes/year) per capita | 4.32 tn |
| 2013 CO2 emissions intensity (tonnes/km²/year) | 26,429.4 tons/km² |
Natural Hazards Risk
Relative risk out of 10
| Hazard | Risk Level |
|---|---|
| Flood | Medium (4) |
* Risk, particularly concerning flood or landslide, may not be for the entire area.
About Our Data
The data on this page is estimated using a number of publicly available tools and resources. It is provided without warranty, and could contain inaccuracies. Use at your own risk.