Postal Code 45000 - Tacuarembó Department
Tacuarembó Department | Uruguay
| Area of Postal Code 45000 | 14,850.8 km² |
| Population | 77,775 |
| Male Population | 38,281 (49.2%) |
| Female Population | 39,494 (50.8%) |
| Population change from 1975 to 2015 | +16.5% |
| Population change from 2000 to 2015 | +1.3% |
| Median Age | 33.1 years |
| Male Median Age | 32 years |
| Female Median Age | 34.2 years |
| Timezone | Uruguay Standard Time |
| Coordinates | -31.996686114362163° / -55.72556673054802° |
| Related Postal Codes | 40000, 45001, 45002, 45003, 45004, 45005, 45006, 45011, 45017, 45020 |
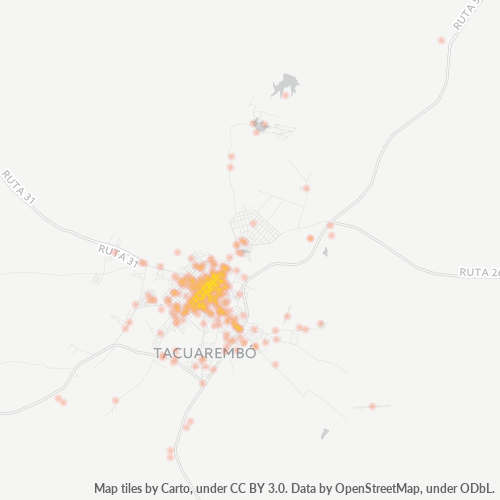
Map of Postal Code 45000 - Tacuarembó Department
Interactive Map
Postal Code 45000 - Tacuarembó Department Population
Years 1975 to 2020
| Data | 1975 | 1990 | 2000 | 2015 | 2020 |
|---|---|---|---|---|---|
| Population | 66,732 | 74,502 | 76,778 | 77,775 | 77,830 |
| Population Density | 4.5 / km² | 5 / km² | 5.2 / km² | 5.2 / km² | 5.2 / km² |
Sources: JRC (European Commission's Joint Research Centre) work on the GHS built-up grid
Postal Code 45000 - Tacuarembó Department Population change from 2000 to 2015
Increase of 1.3% from year 2000 to 2015
| Location | Change since 1975 | Change since 1990 | Change since 2000 |
|---|---|---|---|
| Postal Code 45000 - Tacuarembó Department | +16.5% | +4.4% | +1.3% |
| Tacuarembó Department | +13.3% | +1.1% | -0.9% |
| Uruguay | +21.1% | +10.3% | +3.3% |
Sources: JRC (European Commission's Joint Research Centre) work on the GHS built-up grid
Postal Code 45000 - Tacuarembó Department Median Age
Median Age: 33.1 years
| Location | Median Age | Median Age (Female) | Median Age (Male) |
|---|---|---|---|
| Postal Code 45000 - Tacuarembó Department | 33.1 yrs | 34.2 yrs | 32 yrs |
| Tacuarembó Department | 33.2 yrs | 34.2 yrs | 32.1 yrs |
| Uruguay | 34.5 yrs | 36.1 yrs | 32.7 yrs |
Sources: CIESIN (Center for International Earth Science Information Network)
Postal Code 45000 Population Density
Population Density: 5.2 / km²
| Location | Population | Area | Density |
|---|---|---|---|
| Postal Code 45000 | 77,775 | 14,850.8 km² | 5.2 / km² |
| Tacuarembó Department | 95,538 | 15,945.8 km² | 6 / km² |
| Uruguay | 3.4 million | 177,726.8 km² | 19.2 / km² |
Sources: JRC (European Commission's Joint Research Centre) work on the GHS built-up grid
Postal Code 45000 - Tacuarembó Department Historical and Projected Population
Estimated Population from 1760 to 2100
Sources:
- JRC (European Commission's Joint Research Centre) work on the GHS built-up grid
- CIESIN (Center for International Earth Science Information Network)
- [Link] Klein Goldewijk, K., Beusen, A., Doelman, J., and Stehfest, E.: Anthropogenic land use estimates for the Holocene – HYDE 3.2, Earth Syst. Sci. Data, 9, 927–953, https://doi.org/10.5194/essd-9-927-2017, 2017.
Business Concentration in Postal Code 45000 - Tacuarembó Department
Industries
Business Distribution by Industry in Postal Code 45000 - Tacuarembó Department
| Industry Description | Number of Establishments |
|---|---|
| Beauty salons | 71 |
| Car repair | 84 |
| Churches | 47 |
| Clothing stores | 97 |
| Education | 137 |
| Grocery stores and supermarkets | 156 |
| Hardware store | 45 |
| Other accommodation | 44 |
| Restaurants | 81 |
| Shopping | 245 |
Human Development Index (HDI)
Statistic composite index of life expectancy, education, and per capita income.
Source: [Link] Kummu, M., Taka, M. &Guillaume, J. Gridded global datasets for Gross Domestic Product and Human Development Index over 1990–2015. Sci Data 5, 180004 (2018) doi:10.1038/sdata.2018.4
Postal Code 45000 CO2 Emissions
Carbon Dioxide (CO2) Emissions Per Capita in Tonnes Per Year
| Location | CO2 Emissions | CO2 Emissions Per Capita | CO2 Emissions Intensity |
|---|---|---|---|
| Postal Code 45000 | 293,488 tn | 3.77 tn | 19.8 tons/km² |
| Tacuarembó Department | 359,760 tn | 3.77 tn | 22.6 tons/km² |
| Uruguay | 13,592,928 tn | 3.98 tn | 76.5 tons/km² |
Sources: [Link] Moran, D., Kanemoto K; Jiborn, M., Wood, R., Többen, J., and Seto, K.C. (2018) Carbon footprints of 13,000 cities. Environmental Research Letters DOI: 10.1088/1748-9326/aac72a
Postal Code 45000 CO2 Emissions
| 2013 CO2 emissions (tonnes/year) | 293,488 tn |
| 2013 CO2 emissions (tonnes/year) per capita | 3.77 tn |
| 2013 CO2 emissions intensity (tonnes/km²/year) | 19.8 tons/km² |
Natural Hazards Risk
Relative risk out of 10
| Hazard | Risk Level |
|---|---|
| Flood | High (8) |
* Risk, particularly concerning flood or landslide, may not be for the entire area.
About Our Data
The data on this page is estimated using a number of publicly available tools and resources. It is provided without warranty, and could contain inaccuracies. Use at your own risk.