Postal Code 04019 - Italy
Italy
| Area of Postal Code 04019 | 138.3 km² |
| Population | 46,998 |
| Male Population | 23,577 (50.2%) |
| Female Population | 23,421 (49.8%) |
| Population change from 1975 to 2015 | +99.8% |
| Population change from 2000 to 2015 | +30.0% |
| Median Age | 41.3 years |
| Male Median Age | 40.4 years |
| Female Median Age | 42.2 years |
| Timezone | Central European Summer Time |
| Coordinates | 41.316002908819186° / 13.190537058898176° |
| Related Postal Codes | 04010, 04011, 04012, 04013, 04014, 04015, 04016, 04017, 04018, 04028 |
Map of Postal Code 04019 - Italy
Interactive Map
Postal Code 04019 - Italy Population
Years 1975 to 2020
| Data | 1975 | 1990 | 2000 | 2015 | 2020 |
|---|---|---|---|---|---|
| Population | 23,528 | 30,931 | 36,152 | 46,998 | 46,862 |
| Population Density | 170.1 / km² | 223.6 / km² | 261.3 / km² | 339.8 / km² | 338.8 / km² |
Sources: JRC (European Commission's Joint Research Centre) work on the GHS built-up grid
Postal Code 04019 - Italy Population change from 2000 to 2015
Increase of 30% from year 2000 to 2015
| Location | Change since 1975 | Change since 1990 | Change since 2000 |
|---|---|---|---|
| Postal Code 04019 - Italy | +99.8% | +51.9% | +30% |
| Italy | +8.3% | +4.9% | +4.7% |
Sources: JRC (European Commission's Joint Research Centre) work on the GHS built-up grid
Postal Code 04019 - Italy Median Age
Median Age: 41.3 years
| Location | Median Age | Median Age (Female) | Median Age (Male) |
|---|---|---|---|
| Postal Code 04019 - Italy | 41.3 yrs | 42.2 yrs | 40.4 yrs |
| Italy | 40.9 yrs | 41.5 yrs | 40.3 yrs |
Sources: CIESIN (Center for International Earth Science Information Network)
Postal Code 04019 Population Density
Population Density: 340 / km²
| Location | Population | Area | Density |
|---|---|---|---|
| Postal Code 04019 | 46,998 | 138.3 km² | 340 / km² |
| Italy | 59.3 million | 301,510.7 km² | 197 / km² |
Sources: JRC (European Commission's Joint Research Centre) work on the GHS built-up grid
Postal Code 04019 - Italy Historical and Projected Population
Estimated Population from 0 to 2100
Sources:
- JRC (European Commission's Joint Research Centre) work on the GHS built-up grid
- CIESIN (Center for International Earth Science Information Network)
- [Link] Klein Goldewijk, K., Beusen, A., Doelman, J., and Stehfest, E.: Anthropogenic land use estimates for the Holocene – HYDE 3.2, Earth Syst. Sci. Data, 9, 927–953, https://doi.org/10.5194/essd-9-927-2017, 2017.
Area Codes
Percentage Area Codes used by businesses in Postal Code 04019 - Italy
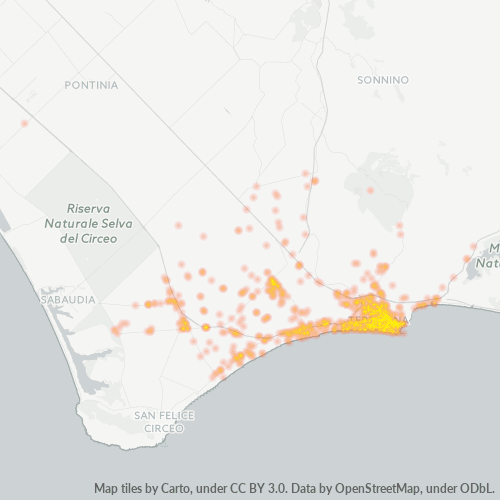
Business Concentration in Postal Code 04019 - Italy
Industries
Business Distribution by Industry in Postal Code 04019 - Italy
| Industry Description | Number of Establishments |
|---|---|
| All food and beverage | 83 |
| Bars, pubs and taverns | 188 |
| Beauty salons | 72 |
| Car repair | 66 |
| Clothing stores | 111 |
| Construction of buildings | 59 |
| Corporate management | 112 |
| Grocery stores and supermarkets | 125 |
| Lawyers legal | 69 |
| Other accommodation | 145 |
| Real estate | 123 |
| Restaurants | 291 |
| Shopping | 233 |
Business distribution by price for Postal Code 04019 - Italy
Human Development Index (HDI)
Statistic composite index of life expectancy, education, and per capita income.
Source: [Link] Kummu, M., Taka, M. &Guillaume, J. Gridded global datasets for Gross Domestic Product and Human Development Index over 1990–2015. Sci Data 5, 180004 (2018) doi:10.1038/sdata.2018.4
Postal Code 04019 CO2 Emissions
Carbon Dioxide (CO2) Emissions Per Capita in Tonnes Per Year
| Location | CO2 Emissions | CO2 Emissions Per Capita | CO2 Emissions Intensity |
|---|---|---|---|
| Postal Code 04019 | 286,787 tn | 6.1 tn | 2,073.2 tons/km² |
| Italy | 399,008,505 tn | 6.73 tn | 1,323.4 tons/km² |
Sources: [Link] Moran, D., Kanemoto K; Jiborn, M., Wood, R., Többen, J., and Seto, K.C. (2018) Carbon footprints of 13,000 cities. Environmental Research Letters DOI: 10.1088/1748-9326/aac72a
Postal Code 04019 CO2 Emissions
| 2013 CO2 emissions (tonnes/year) | 286,787 tn |
| 2013 CO2 emissions (tonnes/year) per capita | 6.1 tn |
| 2013 CO2 emissions intensity (tonnes/km²/year) | 2,073.2 tons/km² |
Natural Hazards Risk
Relative risk out of 10
| Hazard | Risk Level |
|---|---|
| Earthquake | Medium (4) |
| Landslide | Medium (6) |
* Risk, particularly concerning flood or landslide, may not be for the entire area.
Recent Nearby Earthquakes
Magnitude 3.0 and greater
| Date▼ | Time↕ | Magnitude↕ | Distance↕ | Depth↕ | Location↕ | Link |
|---|---|---|---|---|---|---|
| 6/23/19 | 1:43 PM | 3.4 | 69.3 km | 12,600 m | 1km N of Colonna, Italy | usgs.gov |
| 1/1/19 | 10:37 AM | 4.3 | 72.7 km | 16,110 m | 4km SSW of Trasacco, Italy | usgs.gov |
| 11/1/17 | 4:12 PM | 4.1 | 99.6 km | 438,230 m | 55km SW of Forio, Italy | usgs.gov |
| 9/10/17 | 12:58 PM | 3.9 | 94.8 km | 5,000 m | 3km SE of Borgorose, Italy | usgs.gov |
| 8/21/17 | 11:57 AM | 4.2 | 86.4 km | 2,650 m | 4km NNE of Casamicciola Terme, Italy | usgs.gov |
| 2/27/15 | 7:16 PM | 4.2 | 79 km | 17,300 m | 2km N of Trasacco, Italy | usgs.gov |
| 1/1/15 | 11:48 AM | 4.2 | 97.2 km | 318,140 m | 2km WNW of Roccamandolfi, Italy | usgs.gov |
| 2/16/13 | 1:16 PM | 4.8 | 54.7 km | 10,700 m | 3km SSE of Balsorano Vecchio, Italy | usgs.gov |
| 7/12/12 | 2:23 PM | 4 | 86.8 km | 423,000 m | Tyrrhenian Sea | usgs.gov |
| 8/6/09 | 8:36 AM | 4.2 | 53 km | 11,100 m | southern Italy | usgs.gov |
Showing 1-10 of 108
…
Source: U.S. Geological Survey (USGS)
About Our Data
The data on this page is estimated using a number of publicly available tools and resources. It is provided without warranty, and could contain inaccuracies. Use at your own risk.