Postal Code 39054 - Italy
Italy
| Area of Postal Code 39054 | 110.3 km² |
| Population | 8,339 |
| Male Population | 4,225 (50.7%) |
| Female Population | 4,114 (49.3%) |
| Population change from 1975 to 2020 | +52.6% |
| Population change from 2000 to 2020 | +23.5% |
| Median Age | 36.3 years |
| Male Median Age | 36.3 years |
| Female Median Age | 36.2 years |
| Timezone | Central European Summer Time |
| Coordinates | 46.554396893589875° / 11.43576839800305° |
| Related Postal Codes | 39044, 39050, 39051, 39052, 39053, 39055, 39056, 39057, 39058, 39059 |
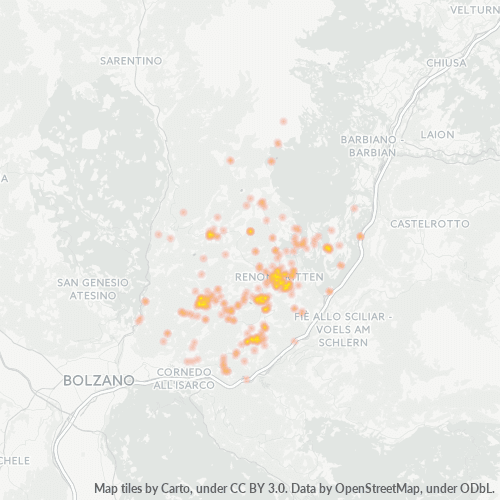
Map of Postal Code 39054 - Italy
Interactive Map
Postal Code 39054 - Italy Population
Years 1975 to 2030
| Data | 1975 | 1990 | 2000 | 2015 | 2020 | 2025* | 2030* |
|---|---|---|---|---|---|---|---|
| Population | 5,464 | 6,331 | 6,751 | 7,552 | 8,339 | 8,413 | 8,460 |
| Population Density | 49.5 / km² | 57.4 / km² | 61.2 / km² | 68.4 / km² | 75.6 / km² | 76.2 / km² | 76.7 / km² |
* Projected
Sources: JRC (European Commission's Joint Research Centre) work on the GHS built-up gridPostal Code 39054 - Italy Population change from 2000 to 2020
Increase of 23.5% from year 2000 to 2020
| Location | Change since 1975 | Change since 1990 | Change since 2000 |
|---|---|---|---|
| Postal Code 39054 - Italy | +52.6% | +31.7% | +23.5% |
| Italy | — | — | — |
Sources: JRC (European Commission's Joint Research Centre) work on the GHS built-up grid
Postal Code 39054 - Italy Median Age
Median Age: 36.3 years
| Location | Median Age | Median Age (Female) | Median Age (Male) |
|---|---|---|---|
| Postal Code 39054 - Italy | 36.3 yrs | 36.2 yrs | 36.3 yrs |
| Italy | 40.9 yrs | 41.5 yrs | 40.3 yrs |
Sources: CIESIN (Center for International Earth Science Information Network)
Postal Code 39054 Population Density
Population Density: 75.6 / km²
| Location | Population | Area | Density |
|---|---|---|---|
| Postal Code 39054 | 8,339 | 110.3 km² | 75.6 / km² |
| Italy | 59.3 million | 301,510.7 km² | 197 / km² |
Sources: JRC (European Commission's Joint Research Centre) work on the GHS built-up grid
Postal Code 39054 - Italy Historical and Projected Population
Estimated Population from 0 to 2100
Sources:
- JRC (European Commission's Joint Research Centre) work on the GHS built-up grid
- CIESIN (Center for International Earth Science Information Network)
- [Link] Klein Goldewijk, K., Beusen, A., Doelman, J., and Stehfest, E.: Anthropogenic land use estimates for the Holocene – HYDE 3.2, Earth Syst. Sci. Data, 9, 927–953, https://doi.org/10.5194/essd-9-927-2017, 2017.
Business Concentration in Postal Code 39054 - Italy
Industries
Business Distribution by Industry in Postal Code 39054 - Italy
| Industry Description | Number of Establishments |
|---|---|
| All food and beverage | 17 |
| Bars, pubs and taverns | 14 |
| Buses and trains | 16 |
| Churches | 18 |
| Construction of buildings | 24 |
| Corporate management | 24 |
| Education | 12 |
| Electrical installation | 16 |
| Grocery stores and supermarkets | 18 |
| Hotels and motels | 30 |
| Other accommodation | 130 |
| Real estate | 16 |
| Restaurants | 43 |
| Shopping | 14 |
| Shopping other | 12 |
| Tractors and farm equipment | 30 |
| Travel agencies | 26 |
Business distribution by price for Postal Code 39054 - Italy
Human Development Index (HDI)
Statistic composite index of life expectancy, education, and per capita income.
Source: [Link] Kummu, M., Taka, M. &Guillaume, J. Gridded global datasets for Gross Domestic Product and Human Development Index over 1990–2015. Sci Data 5, 180004 (2018) doi:10.1038/sdata.2018.4
Postal Code 39054 - Italy Gross Domestic Product (GDP)
GDP per capita, PPP (constant 2017 international $)
| Data | 1990 | 1995 | 2000 | 2005 | 2010 | 2015 | 2020 | 2022 |
|---|---|---|---|---|---|---|---|---|
| GDP per capita | $51,592 | $54,877 | $60,606 | $60,233 | $61,784 | $63,220 | $61,599 | $69,687 |
| Total GDP | $345.3M | $370.5M | $414.5M | $427.6M | $458.2M | $486.3M | $485.4M | $550.6M |
Source: [Link] Kummu, M., Kosonen, M. & Masoumzadeh Sayyar, S. Downscaled gridded global dataset for gross domestic product (GDP) per capita PPP over 1990–2022. Sci Data 12, 178 (2025) doi:10.1038/s41597-025-04487-x
Postal Code 39054 CO2 Emissions
Carbon Dioxide (CO2) Emissions Per Capita in Tonnes Per Year
| Location | CO2 Emissions | CO2 Emissions Per Capita | CO2 Emissions Intensity |
|---|---|---|---|
| Postal Code 39054 | 59,389 tn | 7.12 tn | 538.2 tons/km² |
| Italy | 399,008,505 tn | 6.73 tn | 1,323.4 tons/km² |
Sources: [Link] Moran, D., Kanemoto K; Jiborn, M., Wood, R., Többen, J., and Seto, K.C. (2018) Carbon footprints of 13,000 cities. Environmental Research Letters DOI: 10.1088/1748-9326/aac72a
Postal Code 39054 CO2 Emissions
| 2013 CO2 emissions (tonnes/year) | 59,389 tn |
| 2013 CO2 emissions (tonnes/year) per capita | 7.12 tn |
| 2013 CO2 emissions intensity (tonnes/km²/year) | 538.2 tons/km² |
Natural Hazards Risk
Relative risk out of 10
| Hazard | Risk Level |
|---|---|
| Earthquake | Medium (4) |
| Landslide | Medium (6) |
* Risk, particularly concerning flood or landslide, may not be for the entire area.
Recent Nearby Earthquakes
Magnitude 3.0 and greater
| Date▼ | Time↕ | Magnitude↕ | Distance↕ | Depth↕ | Location↕ | Link |
|---|---|---|---|---|---|---|
| 11/3/17 | 11:15 AM | 3.5 | 70.5 km | 10,000 m | 2km NNW of Mieders, Austria | usgs.gov |
| 8/1/15 | 1:47 PM | 3.9 | 89.1 km | 6,500 m | 3km N of Molina di Ledro, Italy | usgs.gov |
| 5/14/15 | 10:35 PM | 3.5 | 93 km | 12,400 m | 2km SW of Moriago della Battaglia, Italy | usgs.gov |
| 5/11/15 | 7:02 PM | 3.5 | 90 km | 2,000 m | 1km ENE of Vidor, Italy | usgs.gov |
| 8/24/13 | 6:59 AM | 3.6 | 89.7 km | 9,200 m | 5km SSW of Claut, Italy | usgs.gov |
| 8/9/13 | 3:44 AM | 3.7 | 76.5 km | 6,400 m | 1km ENE of Sistrans, Austria | usgs.gov |
| 6/8/12 | 7:04 PM | 4.5 | 86.5 km | 7,000 m | northern Italy | usgs.gov |
| 9/13/11 | 11:35 AM | 3.5 | 90.6 km | 3,200 m | northern Italy | usgs.gov |
| 10/18/10 | 5:38 PM | 4 | 93.2 km | 6,600 m | Austria | usgs.gov |
| 10/10/08 | 3:43 PM | 3.2 | 57.8 km | 11,000 m | northern Italy | usgs.gov |
Showing 1-10 of 217
…
Source: U.S. Geological Survey (USGS)
Cities
Percentage of businesses by city in Postal Code 39054 - Italy
About Our Data
The data on this page is estimated using a number of publicly available tools and resources. It is provided without warranty, and could contain inaccuracies. Use at your own risk.