Postal Code 40018 - Italy
Italy
| Area of Postal Code 40018 | 65.8 km² |
| Population | 12,834 |
| Male Population | 6,494 (50.6%) |
| Female Population | 6,340 (49.4%) |
| Population change from 1975 to 2020 | +98.0% |
| Population change from 2000 to 2020 | +39.8% |
| Median Age | 41.5 years |
| Male Median Age | 41 years |
| Female Median Age | 42 years |
| Timezone | Central European Summer Time |
| Coordinates | 44.710505699806376° / 11.404942513163286° |
| Related Postal Codes | 40010, 40011, 40012, 40013, 40014, 40015, 40016, 40017, 40019, 40027 |
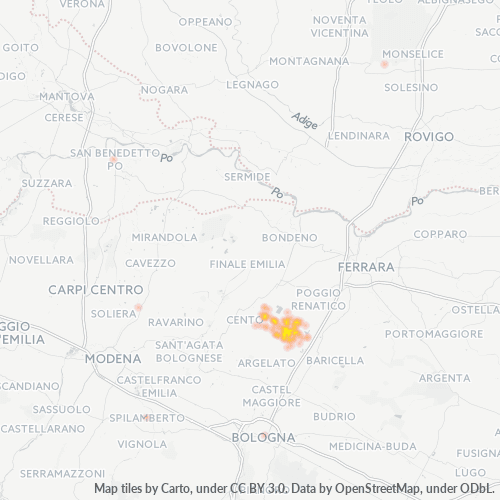
Map of Postal Code 40018 - Italy
Interactive Map
Postal Code 40018 - Italy Population
Years 1975 to 2030
| Data | 1975 | 1990 | 2000 | 2015 | 2020 | 2025* | 2030* |
|---|---|---|---|---|---|---|---|
| Population | 6,483 | 7,950 | 9,182 | 12,078 | 12,834 | 12,896 | 12,946 |
| Population Density | 98.5 / km² | 120.7 / km² | 139.5 / km² | 183.4 / km² | 194.9 / km² | 195.9 / km² | 196.6 / km² |
* Projected
Sources: JRC (European Commission's Joint Research Centre) work on the GHS built-up gridPostal Code 40018 - Italy Population change from 2000 to 2020
Increase of 39.8% from year 2000 to 2020
| Location | Change since 1975 | Change since 1990 | Change since 2000 |
|---|---|---|---|
| Postal Code 40018 - Italy | +98% | +61.4% | +39.8% |
| Italy | — | — | — |
Sources: JRC (European Commission's Joint Research Centre) work on the GHS built-up grid
Postal Code 40018 - Italy Median Age
Median Age: 41.5 years
| Location | Median Age | Median Age (Female) | Median Age (Male) |
|---|---|---|---|
| Postal Code 40018 - Italy | 41.5 yrs | 42 yrs | 41 yrs |
| Italy | 40.9 yrs | 41.5 yrs | 40.3 yrs |
Sources: CIESIN (Center for International Earth Science Information Network)
Postal Code 40018 Population Density
Population Density: 195 / km²
| Location | Population | Area | Density |
|---|---|---|---|
| Postal Code 40018 | 12,834 | 65.8 km² | 195 / km² |
| Italy | 59.3 million | 301,510.7 km² | 197 / km² |
Sources: JRC (European Commission's Joint Research Centre) work on the GHS built-up grid
Postal Code 40018 - Italy Historical and Projected Population
Estimated Population from 0 to 2100
Sources:
- JRC (European Commission's Joint Research Centre) work on the GHS built-up grid
- CIESIN (Center for International Earth Science Information Network)
- [Link] Klein Goldewijk, K., Beusen, A., Doelman, J., and Stehfest, E.: Anthropogenic land use estimates for the Holocene – HYDE 3.2, Earth Syst. Sci. Data, 9, 927–953, https://doi.org/10.5194/essd-9-927-2017, 2017.
Business Concentration in Postal Code 40018 - Italy
Industries
Business Distribution by Industry in Postal Code 40018 - Italy
| Industry Description | Number of Establishments |
|---|---|
| All food and beverage | 15 |
| Bars, pubs and taverns | 40 |
| Construction of buildings | 34 |
| Corporate management | 26 |
| Education | 14 |
| Electrical installation | 17 |
| Financial services | 14 |
| Gas station | 16 |
| Grocery stores and supermarkets | 17 |
| Hairdressers | 15 |
| Real estate | 26 |
| Restaurants | 47 |
| Shopping | 51 |
| Wholesale of machinery | 17 |
Business distribution by price for Postal Code 40018 - Italy
Human Development Index (HDI)
Statistic composite index of life expectancy, education, and per capita income.
Source: [Link] Kummu, M., Taka, M. &Guillaume, J. Gridded global datasets for Gross Domestic Product and Human Development Index over 1990–2015. Sci Data 5, 180004 (2018) doi:10.1038/sdata.2018.4
Postal Code 40018 - Italy Gross Domestic Product (GDP)
GDP per capita, PPP (constant 2017 international $)
| Data | 1990 | 1995 | 2000 | 2005 | 2010 | 2015 | 2020 | 2022 |
|---|---|---|---|---|---|---|---|---|
| GDP per capita | $50,105 | $53,295 | $58,859 | $57,162 | $56,496 | $55,772 | $53,941 | $61,024 |
| Total GDP | $978.2M | $1B | $1.2B | $1.2B | $1.3B | $1.4B | $1.4B | $1.6B |
Source: [Link] Kummu, M., Kosonen, M. & Masoumzadeh Sayyar, S. Downscaled gridded global dataset for gross domestic product (GDP) per capita PPP over 1990–2022. Sci Data 12, 178 (2025) doi:10.1038/s41597-025-04487-x
Postal Code 40018 CO2 Emissions
Carbon Dioxide (CO2) Emissions Per Capita in Tonnes Per Year
| Location | CO2 Emissions | CO2 Emissions Per Capita | CO2 Emissions Intensity |
|---|---|---|---|
| Postal Code 40018 | 111,980 tn | 8.73 tn | 1,700.8 tons/km² |
| Italy | 399,008,505 tn | 6.73 tn | 1,323.4 tons/km² |
Sources: [Link] Moran, D., Kanemoto K; Jiborn, M., Wood, R., Többen, J., and Seto, K.C. (2018) Carbon footprints of 13,000 cities. Environmental Research Letters DOI: 10.1088/1748-9326/aac72a
Postal Code 40018 CO2 Emissions
| 2013 CO2 emissions (tonnes/year) | 111,980 tn |
| 2013 CO2 emissions (tonnes/year) per capita | 8.73 tn |
| 2013 CO2 emissions intensity (tonnes/km²/year) | 1,700.8 tons/km² |
Natural Hazards Risk
Relative risk out of 10
| Hazard | Risk Level |
|---|---|
| Earthquake | Medium (6) |
* Risk, particularly concerning flood or landslide, may not be for the entire area.
Recent Nearby Earthquakes
Magnitude 3.0 and greater
| Date▼ | Time↕ | Magnitude↕ | Distance↕ | Depth↕ | Location↕ | Link |
|---|---|---|---|---|---|---|
| 8/20/18 | 5:33 PM | 4.1 | 59.4 km | 19,850 m | 3km WNW of Novellara, Italy | usgs.gov |
| 5/3/18 | 11:46 AM | 4.3 | 80 km | 10,000 m | 0km W of Rocca San Casciano, Italy | usgs.gov |
| 11/29/16 | 9:52 PM | 3.7 | 61.3 km | 23,830 m | 3km SW of Bagnolo in Piano, Italy | usgs.gov |
| 8/23/15 | 8:43 PM | 3.5 | 65.7 km | 22,000 m | 5km ESE of Faenza, Italy | usgs.gov |
| 7/22/15 | 5:57 AM | 3.6 | 73.6 km | 10,000 m | 0km WSW of Lizzano in Belvedere, Italy | usgs.gov |
| 4/24/15 | 8:02 AM | 4.5 | 66.5 km | 20,900 m | 6km SSE of Faenza, Italy | usgs.gov |
| 2/17/15 | 11:42 AM | 3.9 | 60.4 km | 7,200 m | 5km NNE of Firenzuola, Italy | usgs.gov |
| 1/22/15 | 10:51 PM | 4.5 | 68.1 km | 9,700 m | 2km WSW of Castiglione dei Pepoli, Italy | usgs.gov |
| 5/3/13 | 10:11 PM | 3.8 | 17.8 km | 8,000 m | 3km SE of Bondeno, Italy | usgs.gov |
| 6/19/12 | 2:48 PM | 3.5 | 36.4 km | 6,600 m | northern Italy | usgs.gov |
Showing 1-10 of 500
…
Source: U.S. Geological Survey (USGS)
About Our Data
The data on this page is estimated using a number of publicly available tools and resources. It is provided without warranty, and could contain inaccuracies. Use at your own risk.