Postal Code 53018 - Italy
Italy
| Area of Postal Code 53018 | 143.9 km² |
| Population | 10,459 |
| Male Population | 5,124 (49.0%) |
| Female Population | 5,335 (51.0%) |
| Population change from 1975 to 2015 | +83.6% |
| Population change from 2000 to 2015 | +26.5% |
| Median Age | 41.2 years |
| Male Median Age | 40.8 years |
| Female Median Age | 41.5 years |
| Timezone | Central European Summer Time |
| Coordinates | 43.24635603004115° / 11.22681029156302° |
| Related Postal Codes | 53010, 53011, 53012, 53013, 53014, 53015, 53016, 53017, 53019, 53027 |
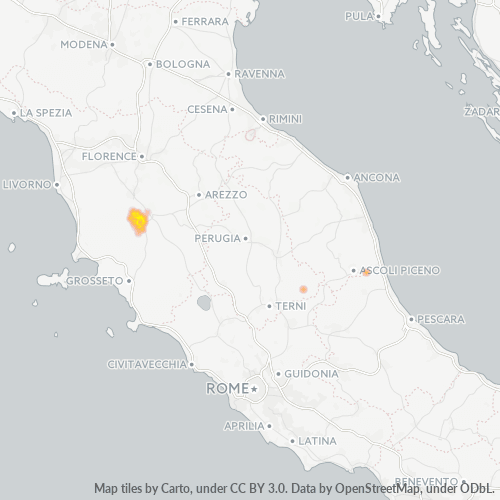
Map of Postal Code 53018 - Italy
Interactive Map
Postal Code 53018 - Italy Population
Years 1975 to 2020
| Data | 1975 | 1990 | 2000 | 2015 | 2020 |
|---|---|---|---|---|---|
| Population | 5,696 | 7,240 | 8,271 | 10,459 | 10,391 |
| Population Density | 39.6 / km² | 50.3 / km² | 57.5 / km² | 72.7 / km² | 72.2 / km² |
Sources: JRC (European Commission's Joint Research Centre) work on the GHS built-up grid
Postal Code 53018 - Italy Population change from 2000 to 2015
Increase of 26.5% from year 2000 to 2015
| Location | Change since 1975 | Change since 1990 | Change since 2000 |
|---|---|---|---|
| Postal Code 53018 - Italy | +83.6% | +44.5% | +26.5% |
| Italy | +8.3% | +4.9% | +4.7% |
Sources: JRC (European Commission's Joint Research Centre) work on the GHS built-up grid
Postal Code 53018 - Italy Median Age
Median Age: 41.2 years
| Location | Median Age | Median Age (Female) | Median Age (Male) |
|---|---|---|---|
| Postal Code 53018 - Italy | 41.2 yrs | 41.5 yrs | 40.8 yrs |
| Italy | 40.9 yrs | 41.5 yrs | 40.3 yrs |
Sources: CIESIN (Center for International Earth Science Information Network)
Postal Code 53018 Population Density
Population Density: 72.7 / km²
| Location | Population | Area | Density |
|---|---|---|---|
| Postal Code 53018 | 10,459 | 143.9 km² | 72.7 / km² |
| Italy | 59.3 million | 301,510.7 km² | 197 / km² |
Sources: JRC (European Commission's Joint Research Centre) work on the GHS built-up grid
Postal Code 53018 - Italy Historical and Projected Population
Estimated Population from 0 to 2100
Sources:
- JRC (European Commission's Joint Research Centre) work on the GHS built-up grid
- CIESIN (Center for International Earth Science Information Network)
- [Link] Klein Goldewijk, K., Beusen, A., Doelman, J., and Stehfest, E.: Anthropogenic land use estimates for the Holocene – HYDE 3.2, Earth Syst. Sci. Data, 9, 927–953, https://doi.org/10.5194/essd-9-927-2017, 2017.
Area Codes
Percentage Area Codes used by businesses in Postal Code 53018 - Italy
Business Concentration in Postal Code 53018 - Italy
Industries
Business Distribution by Industry in Postal Code 53018 - Italy
| Industry Description | Number of Establishments |
|---|---|
| All food and beverage | 14 |
| Bars, pubs and taverns | 17 |
| Buses and trains | 19 |
| Car repair | 11 |
| Cemeteries and crematoriums | 12 |
| Churches | 18 |
| Construction of buildings | 19 |
| Corporate management | 25 |
| Grocery stores and supermarkets | 19 |
| Hotels and motels | 18 |
| Household appliances and goods | 11 |
| Museums | 21 |
| Other accommodation | 98 |
| Other membership organizations | 13 |
| Restaurants | 31 |
| Shopping | 28 |
Business distribution by price for Postal Code 53018 - Italy
Human Development Index (HDI)
Statistic composite index of life expectancy, education, and per capita income.
Source: [Link] Kummu, M., Taka, M. &Guillaume, J. Gridded global datasets for Gross Domestic Product and Human Development Index over 1990–2015. Sci Data 5, 180004 (2018) doi:10.1038/sdata.2018.4
Postal Code 53018 CO2 Emissions
Carbon Dioxide (CO2) Emissions Per Capita in Tonnes Per Year
| Location | CO2 Emissions | CO2 Emissions Per Capita | CO2 Emissions Intensity |
|---|---|---|---|
| Postal Code 53018 | 77,191 tn | 7.38 tn | 536.5 tons/km² |
| Italy | 399,008,505 tn | 6.73 tn | 1,323.4 tons/km² |
Sources: [Link] Moran, D., Kanemoto K; Jiborn, M., Wood, R., Többen, J., and Seto, K.C. (2018) Carbon footprints of 13,000 cities. Environmental Research Letters DOI: 10.1088/1748-9326/aac72a
Postal Code 53018 CO2 Emissions
| 2013 CO2 emissions (tonnes/year) | 77,191 tn |
| 2013 CO2 emissions (tonnes/year) per capita | 7.38 tn |
| 2013 CO2 emissions intensity (tonnes/km²/year) | 536.5 tons/km² |
Natural Hazards Risk
Relative risk out of 10
| Hazard | Risk Level |
|---|---|
| Earthquake | Medium (6) |
* Risk, particularly concerning flood or landslide, may not be for the entire area.
Recent Nearby Earthquakes
Magnitude 3.0 and greater
| Date▼ | Time↕ | Magnitude↕ | Distance↕ | Depth↕ | Location↕ | Link |
|---|---|---|---|---|---|---|
| 4/30/18 | 10:16 PM | 4.1 | 15.5 km | 10,000 m | 9km NNW of Chiusdino, Italy | usgs.gov |
| 10/25/16 | 9:53 AM | 4.2 | 40.9 km | 10,000 m | 5km NNE of Certaldo, Italy | usgs.gov |
| 5/30/16 | 1:24 PM | 4.4 | 84.4 km | 15,000 m | 1km WNW of Castel Giorgio, Italy | usgs.gov |
| 9/12/15 | 6:04 PM | 4.2 | 34.8 km | 4,110 m | 4km SW of Greve, Italy | usgs.gov |
| 3/3/15 | 3:51 PM | 3.3 | 38.8 km | 10,100 m | 3km N of Tavarnelle Val di Pesa, Italy | usgs.gov |
| 3/3/15 | 4:00 PM | 4 | 40 km | 9,200 m | 4km N of Tavarnelle Val di Pesa, Italy | usgs.gov |
| 1/22/15 | 10:51 PM | 4.5 | 98.4 km | 9,700 m | 2km WSW of Castiglione dei Pepoli, Italy | usgs.gov |
| 12/19/14 | 2:36 AM | 3.9 | 40 km | 7,100 m | 5km WNW of Greve, Italy | usgs.gov |
| 12/19/14 | 1:39 AM | 3.8 | 39.8 km | 9,300 m | 5km WNW of Greve, Italy | usgs.gov |
| 10/19/13 | 5:29 AM | 3.4 | 90.6 km | 9,900 m | 5km NNW of Tirrenia, Italy | usgs.gov |
Showing 1-10 of 275
…
Source: U.S. Geological Survey (USGS)
Cities
Percentage of businesses by city in Postal Code 53018 - Italy
About Our Data
The data on this page is estimated using a number of publicly available tools and resources. It is provided without warranty, and could contain inaccuracies. Use at your own risk.