Postal Code 71045 - Italy
Italy
| Area of Postal Code 71045 | 105.5 km² |
| Population | 16,520 |
| Male Population | 8,231 (49.8%) |
| Female Population | 8,289 (50.2%) |
| Population change from 1975 to 2015 | -19.1% |
| Population change from 2000 to 2015 | -7.4% |
| Median Age | 37 years |
| Male Median Age | 36.4 years |
| Female Median Age | 37.5 years |
| Timezone | Central European Summer Time |
| Coordinates | 41.3214011672586° / 15.720826840882646° |
| Related Postal Codes | 71035, 71040, 71041, 71042, 71043, 71044, 71046, 71047, 71048, 71049 |
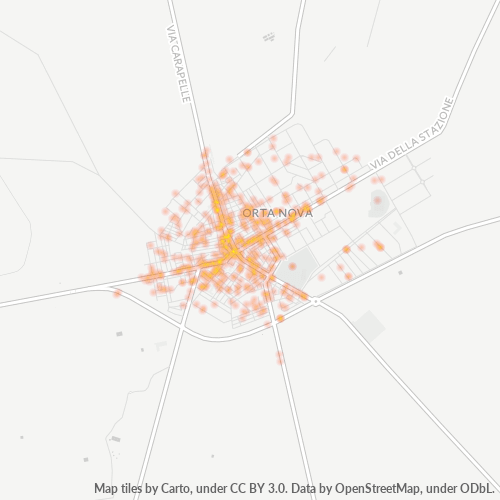
Map of Postal Code 71045 - Italy
Interactive Map
Postal Code 71045 - Italy Population
Years 1975 to 2020
| Data | 1975 | 1990 | 2000 | 2015 | 2020 |
|---|---|---|---|---|---|
| Population | 20,421 | 19,127 | 17,835 | 16,520 | 16,668 |
| Population Density | 193.6 / km² | 181.4 / km² | 169.1 / km² | 156.6 / km² | 158 / km² |
Sources: JRC (European Commission's Joint Research Centre) work on the GHS built-up grid
Postal Code 71045 - Italy Population change from 2000 to 2015
Decrease of 7.4% from year 2000 to 2015
| Location | Change since 1975 | Change since 1990 | Change since 2000 |
|---|---|---|---|
| Postal Code 71045 - Italy | -19.1% | -13.6% | -7.4% |
| Italy | +8.3% | +4.9% | +4.7% |
Sources: JRC (European Commission's Joint Research Centre) work on the GHS built-up grid
Postal Code 71045 - Italy Median Age
Median Age: 37 years
| Location | Median Age | Median Age (Female) | Median Age (Male) |
|---|---|---|---|
| Postal Code 71045 - Italy | 37 yrs | 37.5 yrs | 36.4 yrs |
| Italy | 40.9 yrs | 41.5 yrs | 40.3 yrs |
Sources: CIESIN (Center for International Earth Science Information Network)
Postal Code 71045 Population Density
Population Density: 157 / km²
| Location | Population | Area | Density |
|---|---|---|---|
| Postal Code 71045 | 16,520 | 105.5 km² | 157 / km² |
| Italy | 59.3 million | 301,510.7 km² | 197 / km² |
Sources: JRC (European Commission's Joint Research Centre) work on the GHS built-up grid
Postal Code 71045 - Italy Historical and Projected Population
Estimated Population from 0 to 2100
Sources:
- JRC (European Commission's Joint Research Centre) work on the GHS built-up grid
- CIESIN (Center for International Earth Science Information Network)
- [Link] Klein Goldewijk, K., Beusen, A., Doelman, J., and Stehfest, E.: Anthropogenic land use estimates for the Holocene – HYDE 3.2, Earth Syst. Sci. Data, 9, 927–953, https://doi.org/10.5194/essd-9-927-2017, 2017.
Area Codes
Percentage Area Codes used by businesses in Postal Code 71045 - Italy
Business Concentration in Postal Code 71045 - Italy
Industries
Business Distribution by Industry in Postal Code 71045 - Italy
| Industry Description | Number of Establishments |
|---|---|
| All food and beverage | 23 |
| Bars, pubs and taverns | 42 |
| Car repair | 19 |
| Clothing stores | 33 |
| Construction of buildings | 20 |
| Corporate management | 37 |
| Education | 19 |
| Electrical installation | 20 |
| Financial services | 18 |
| Gas station | 16 |
| Grocery stores and supermarkets | 45 |
| Lawyers legal | 26 |
| Restaurants | 37 |
| Shopping | 88 |
| Wholesale of construction supplies | 18 |
Business distribution by price for Postal Code 71045 - Italy
Human Development Index (HDI)
Statistic composite index of life expectancy, education, and per capita income.
Source: [Link] Kummu, M., Taka, M. &Guillaume, J. Gridded global datasets for Gross Domestic Product and Human Development Index over 1990–2015. Sci Data 5, 180004 (2018) doi:10.1038/sdata.2018.4
Postal Code 71045 CO2 Emissions
Carbon Dioxide (CO2) Emissions Per Capita in Tonnes Per Year
| Location | CO2 Emissions | CO2 Emissions Per Capita | CO2 Emissions Intensity |
|---|---|---|---|
| Postal Code 71045 | 86,061 tn | 5.21 tn | 816 tons/km² |
| Italy | 399,008,505 tn | 6.73 tn | 1,323.4 tons/km² |
Sources: [Link] Moran, D., Kanemoto K; Jiborn, M., Wood, R., Többen, J., and Seto, K.C. (2018) Carbon footprints of 13,000 cities. Environmental Research Letters DOI: 10.1088/1748-9326/aac72a
Postal Code 71045 CO2 Emissions
| 2013 CO2 emissions (tonnes/year) | 86,061 tn |
| 2013 CO2 emissions (tonnes/year) per capita | 5.21 tn |
| 2013 CO2 emissions intensity (tonnes/km²/year) | 816 tons/km² |
Natural Hazards Risk
Relative risk out of 10
| Hazard | Risk Level |
|---|---|
| Earthquake | Medium (6) |
* Risk, particularly concerning flood or landslide, may not be for the entire area.
Recent Nearby Earthquakes
Magnitude 3.0 and greater
| Date▼ | Time↕ | Magnitude↕ | Distance↕ | Depth↕ | Location↕ | Link |
|---|---|---|---|---|---|---|
| 8/16/18 | 11:19 AM | 5.3 | 97.8 km | 11,590 m | 2km SE of Palata, Italy | usgs.gov |
| 8/16/18 | 1:22 PM | 4.5 | 97.1 km | 3,240 m | 3km NNW of Guardialfiera, Italy | usgs.gov |
| 8/14/18 | 2:48 PM | 4.6 | 98.4 km | 10,000 m | 1km SE of Palata, Italy | usgs.gov |
| 4/25/18 | 2:48 AM | 4.3 | 99.7 km | 10,000 m | 1km W of Montecilfone, Italy | usgs.gov |
| 4/22/17 | 9:25 PM | 4.1 | 72.4 km | 16,450 m | 5km NW of Rodi Garganico, Italy | usgs.gov |
| 1/16/16 | 10:55 AM | 4.4 | 94 km | 5,400 m | 3km NNW of Campobasso, Italy | usgs.gov |
| 12/24/14 | 3:40 AM | 4.4 | 76.3 km | 17,600 m | 1km NNW of San Giuliano di Puglia, Italy | usgs.gov |
| 9/26/12 | 6:08 PM | 4.6 | 66.8 km | 6,300 m | southern Italy | usgs.gov |
| 8/11/12 | 6:21 PM | 4.1 | 67.5 km | 8,400 m | southern Italy | usgs.gov |
| 7/27/11 | 5:13 AM | 3.5 | 70 km | 1,200 m | southern Italy | usgs.gov |
Showing 1-10 of 321
…
Source: U.S. Geological Survey (USGS)
About Our Data
The data on this page is estimated using a number of publicly available tools and resources. It is provided without warranty, and could contain inaccuracies. Use at your own risk.