Postal Code 72019 - Italy
Italy
| Area of Postal Code 72019 | 67.5 km² |
| Population | 19,235 |
| Male Population | 9,425 (49.0%) |
| Female Population | 9,810 (51.0%) |
| Population change from 1975 to 2015 | -14.0% |
| Population change from 2000 to 2015 | -5.2% |
| Median Age | 41 years |
| Male Median Age | 40.2 years |
| Female Median Age | 41.8 years |
| Timezone | Central European Summer Time |
| Coordinates | 40.641111916077534° / 17.70363262979642° |
| Related Postal Codes | 72010, 72012, 72013, 72014, 72015, 72016, 72017, 72018, 72027, 72029 |
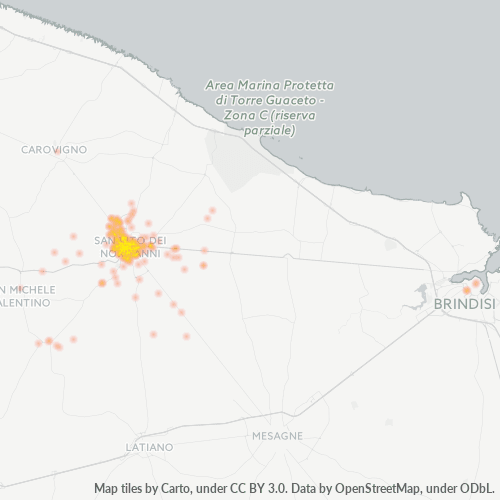
Map of Postal Code 72019 - Italy
Interactive Map
Postal Code 72019 - Italy Population
Years 1975 to 2020
| Data | 1975 | 1990 | 2000 | 2015 | 2020 |
|---|---|---|---|---|---|
| Population | 22,374 | 21,445 | 20,291 | 19,235 | 19,573 |
| Population Density | 331.4 / km² | 317.7 / km² | 300.6 / km² | 284.9 / km² | 289.9 / km² |
Sources: JRC (European Commission's Joint Research Centre) work on the GHS built-up grid
Postal Code 72019 - Italy Population change from 2000 to 2015
Decrease of 5.2% from year 2000 to 2015
| Location | Change since 1975 | Change since 1990 | Change since 2000 |
|---|---|---|---|
| Postal Code 72019 - Italy | -14% | -10.3% | -5.2% |
| Italy | +8.3% | +4.9% | +4.7% |
Sources: JRC (European Commission's Joint Research Centre) work on the GHS built-up grid
Postal Code 72019 - Italy Median Age
Median Age: 41 years
| Location | Median Age | Median Age (Female) | Median Age (Male) |
|---|---|---|---|
| Postal Code 72019 - Italy | 41 yrs | 41.8 yrs | 40.2 yrs |
| Italy | 40.9 yrs | 41.5 yrs | 40.3 yrs |
Sources: CIESIN (Center for International Earth Science Information Network)
Postal Code 72019 Population Density
Population Density: 285 / km²
| Location | Population | Area | Density |
|---|---|---|---|
| Postal Code 72019 | 19,235 | 67.5 km² | 285 / km² |
| Italy | 59.3 million | 301,510.7 km² | 197 / km² |
Sources: JRC (European Commission's Joint Research Centre) work on the GHS built-up grid
Postal Code 72019 - Italy Historical and Projected Population
Estimated Population from 0 to 2100
Sources:
- JRC (European Commission's Joint Research Centre) work on the GHS built-up grid
- CIESIN (Center for International Earth Science Information Network)
- [Link] Klein Goldewijk, K., Beusen, A., Doelman, J., and Stehfest, E.: Anthropogenic land use estimates for the Holocene – HYDE 3.2, Earth Syst. Sci. Data, 9, 927–953, https://doi.org/10.5194/essd-9-927-2017, 2017.
Area Codes
Percentage Area Codes used by businesses in Postal Code 72019 - Italy
Business Concentration in Postal Code 72019 - Italy
Industries
Business Distribution by Industry in Postal Code 72019 - Italy
| Industry Description | Number of Establishments |
|---|---|
| All food and beverage | 34 |
| Bars, pubs and taverns | 55 |
| Beauty salons | 30 |
| Car repair | 24 |
| Clothing stores | 46 |
| Construction of buildings | 30 |
| Corporate management | 27 |
| Gas station | 24 |
| Grocery stores and supermarkets | 54 |
| Health and medical | 26 |
| Lawyers legal | 31 |
| Other accommodation | 88 |
| Restaurants | 41 |
| Shopping | 93 |
| Wholesale of construction supplies | 26 |
Business distribution by price for Postal Code 72019 - Italy
Human Development Index (HDI)
Statistic composite index of life expectancy, education, and per capita income.
Source: [Link] Kummu, M., Taka, M. &Guillaume, J. Gridded global datasets for Gross Domestic Product and Human Development Index over 1990–2015. Sci Data 5, 180004 (2018) doi:10.1038/sdata.2018.4
Postal Code 72019 CO2 Emissions
Carbon Dioxide (CO2) Emissions Per Capita in Tonnes Per Year
| Location | CO2 Emissions | CO2 Emissions Per Capita | CO2 Emissions Intensity |
|---|---|---|---|
| Postal Code 72019 | 103,651 tn | 5.39 tn | 1,535.5 tons/km² |
| Italy | 399,008,505 tn | 6.73 tn | 1,323.4 tons/km² |
Sources: [Link] Moran, D., Kanemoto K; Jiborn, M., Wood, R., Többen, J., and Seto, K.C. (2018) Carbon footprints of 13,000 cities. Environmental Research Letters DOI: 10.1088/1748-9326/aac72a
Postal Code 72019 CO2 Emissions
| 2013 CO2 emissions (tonnes/year) | 103,651 tn |
| 2013 CO2 emissions (tonnes/year) per capita | 5.39 tn |
| 2013 CO2 emissions intensity (tonnes/km²/year) | 1,535.5 tons/km² |
Natural Hazards Risk
Relative risk out of 10
| Hazard | Risk Level |
|---|---|
| Earthquake | Low (2) |
* Risk, particularly concerning flood or landslide, may not be for the entire area.
Recent Nearby Earthquakes
Magnitude 3.0 and greater
| Date▼ | Time↕ | Magnitude↕ | Distance↕ | Depth↕ | Location↕ | Link |
|---|---|---|---|---|---|---|
| 3/23/18 | 4:31 PM | 4.1 | 21.2 km | 11,850 m | 11km NNE of Ostuni, Italy | usgs.gov |
| 8/8/04 | 11:25 AM | 3.2 | 51.8 km | 10,000 m | southern Italy | usgs.gov |
| 4/2/02 | 7:40 AM | 3.2 | 91.3 km | 10,000 m | Adriatic Sea | usgs.gov |
| 3/28/02 | 1:59 AM | 3.1 | 56.8 km | 5,000 m | southern Italy | usgs.gov |
| 1/7/94 | 10:30 AM | 4.1 | 61.6 km | 23,300 m | southern Italy | usgs.gov |
| 12/13/91 | 11:32 AM | 3.4 | 64.3 km | 33,000 m | Adriatic Sea | usgs.gov |
| 11/17/91 | 12:09 AM | 3.3 | 37.6 km | 10,000 m | southern Italy | usgs.gov |
| 4/18/91 | 12:24 PM | 3.4 | 85.4 km | 20,000 m | southern Italy | usgs.gov |
Source: U.S. Geological Survey (USGS)
About Our Data
The data on this page is estimated using a number of publicly available tools and resources. It is provided without warranty, and could contain inaccuracies. Use at your own risk.