Postal Code 90018 - Italy
Italy
| Area of Postal Code 90018 | 77.9 km² |
| Population | 26,888 |
| Male Population | 13,234 (49.2%) |
| Female Population | 13,654 (50.8%) |
| Population change from 1975 to 2015 | -12.8% |
| Population change from 2000 to 2015 | -4.3% |
| Median Age | 39 years |
| Male Median Age | 38.5 years |
| Female Median Age | 39.5 years |
| Timezone | Central European Summer Time |
| Coordinates | 37.95993851207275° / 13.740944675826562° |
| Related Postal Codes | 90010, 90011, 90012, 90013, 90014, 90015, 90016, 90017, 90019, 90027 |
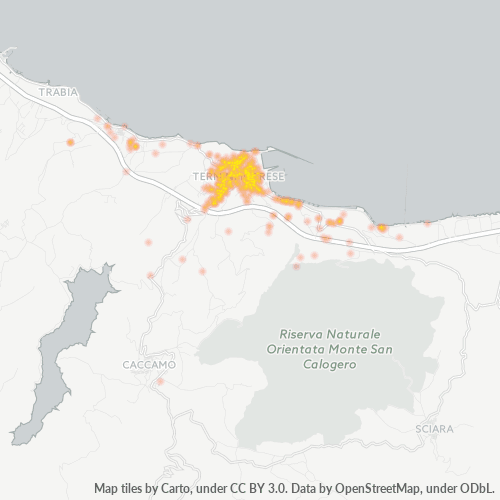
Map of Postal Code 90018 - Italy
Interactive Map
Postal Code 90018 - Italy Population
Years 1975 to 2020
| Data | 1975 | 1990 | 2000 | 2015 | 2020 |
|---|---|---|---|---|---|
| Population | 30,851 | 29,558 | 28,102 | 26,888 | 27,008 |
| Population Density | 395.8 / km² | 379.3 / km² | 360.6 / km² | 345 / km² | 346.5 / km² |
Sources: JRC (European Commission's Joint Research Centre) work on the GHS built-up grid
Postal Code 90018 - Italy Population change from 2000 to 2015
Decrease of 4.3% from year 2000 to 2015
| Location | Change since 1975 | Change since 1990 | Change since 2000 |
|---|---|---|---|
| Postal Code 90018 - Italy | -12.8% | -9% | -4.3% |
| Italy | +8.3% | +4.9% | +4.7% |
Sources: JRC (European Commission's Joint Research Centre) work on the GHS built-up grid
Postal Code 90018 - Italy Median Age
Median Age: 39 years
| Location | Median Age | Median Age (Female) | Median Age (Male) |
|---|---|---|---|
| Postal Code 90018 - Italy | 39 yrs | 39.5 yrs | 38.5 yrs |
| Italy | 40.9 yrs | 41.5 yrs | 40.3 yrs |
Sources: CIESIN (Center for International Earth Science Information Network)
Postal Code 90018 Population Density
Population Density: 345 / km²
| Location | Population | Area | Density |
|---|---|---|---|
| Postal Code 90018 | 26,888 | 77.9 km² | 345 / km² |
| Italy | 59.3 million | 301,510.7 km² | 197 / km² |
Sources: JRC (European Commission's Joint Research Centre) work on the GHS built-up grid
Postal Code 90018 - Italy Historical and Projected Population
Estimated Population from 0 to 2100
Sources:
- JRC (European Commission's Joint Research Centre) work on the GHS built-up grid
- CIESIN (Center for International Earth Science Information Network)
- [Link] Klein Goldewijk, K., Beusen, A., Doelman, J., and Stehfest, E.: Anthropogenic land use estimates for the Holocene – HYDE 3.2, Earth Syst. Sci. Data, 9, 927–953, https://doi.org/10.5194/essd-9-927-2017, 2017.
Business Concentration in Postal Code 90018 - Italy
Industries
Business Distribution by Industry in Postal Code 90018 - Italy
| Industry Description | Number of Establishments |
|---|---|
| Bars, pubs and taverns | 64 |
| Car repair | 37 |
| Clothing stores | 70 |
| Corporate management | 56 |
| Education | 33 |
| Electronics stores | 31 |
| Financial services | 30 |
| Gas station | 39 |
| Grocery stores and supermarkets | 68 |
| Health and medical | 45 |
| Lawyers legal | 60 |
| Other accommodation | 35 |
| Real estate | 30 |
| Restaurants | 62 |
| Shopping | 141 |
Business distribution by price for Postal Code 90018 - Italy
Human Development Index (HDI)
Statistic composite index of life expectancy, education, and per capita income.
Source: [Link] Kummu, M., Taka, M. &Guillaume, J. Gridded global datasets for Gross Domestic Product and Human Development Index over 1990–2015. Sci Data 5, 180004 (2018) doi:10.1038/sdata.2018.4
Postal Code 90018 CO2 Emissions
Carbon Dioxide (CO2) Emissions Per Capita in Tonnes Per Year
| Location | CO2 Emissions | CO2 Emissions Per Capita | CO2 Emissions Intensity |
|---|---|---|---|
| Postal Code 90018 | 122,286 tn | 4.55 tn | 1,569 tons/km² |
| Italy | 399,008,505 tn | 6.73 tn | 1,323.4 tons/km² |
Sources: [Link] Moran, D., Kanemoto K; Jiborn, M., Wood, R., Többen, J., and Seto, K.C. (2018) Carbon footprints of 13,000 cities. Environmental Research Letters DOI: 10.1088/1748-9326/aac72a
Postal Code 90018 CO2 Emissions
| 2013 CO2 emissions (tonnes/year) | 122,286 tn |
| 2013 CO2 emissions (tonnes/year) per capita | 4.55 tn |
| 2013 CO2 emissions intensity (tonnes/km²/year) | 1,569 tons/km² |
Natural Hazards Risk
Relative risk out of 10
| Hazard | Risk Level |
|---|---|
| Drought | High (8) |
| Earthquake | Medium (4) |
* Risk, particularly concerning flood or landslide, may not be for the entire area.
Recent Nearby Earthquakes
Magnitude 3.0 and greater
| Date▼ | Time↕ | Magnitude↕ | Distance↕ | Depth↕ | Location↕ | Link |
|---|---|---|---|---|---|---|
| 12/2/16 | 8:08 PM | 4.5 | 83.3 km | 3,000 m | 60km WNW of Lipari, Italy | usgs.gov |
| 12/20/15 | 1:46 AM | 4.6 | 45.5 km | 5,000 m | 29km N of Santa Flavia, Italy | usgs.gov |
| 8/8/15 | 3:46 PM | 4.1 | 79.7 km | 14,000 m | 59km N of Santo Stefano di Camastra, Italy | usgs.gov |
| 1/3/13 | 11:50 PM | 4.6 | 86.8 km | 10,100 m | Sicily, Italy | usgs.gov |
| 8/13/12 | 12:30 AM | 4.4 | 67.1 km | 10,000 m | Sicily, Italy | usgs.gov |
| 4/12/12 | 11:21 PM | 4.4 | 53 km | 10,000 m | Sicily, Italy | usgs.gov |
| 2/25/12 | 12:34 PM | 4.4 | 60.2 km | 17,000 m | Sicily, Italy | usgs.gov |
| 7/6/11 | 2:08 AM | 3.7 | 93.1 km | 7,500 m | Sicily, Italy | usgs.gov |
| 6/23/11 | 3:02 PM | 4.3 | 90.2 km | 7,000 m | Sicily, Italy | usgs.gov |
| 11/7/09 | 10:51 PM | 4.4 | 77.2 km | 16,500 m | Sicily, Italy | usgs.gov |
Showing 1-10 of 195
…
Source: U.S. Geological Survey (USGS)
About Our Data
The data on this page is estimated using a number of publicly available tools and resources. It is provided without warranty, and could contain inaccuracies. Use at your own risk.