Postal Code 1053 - Budapest X. kerület
| Primary City | Budapest X. kerület |
| Area of Postal Code 1053 | 0.245 km² |
| Population | 39,269 |
| Male Population | 17,815 (45.4%) |
| Female Population | 21,454 (54.6%) |
| Population change from 1975 to 2020 | +1889.3% |
| Population change from 2000 to 2020 | +1264.0% |
| Median Age | 41.8 years |
| Male Median Age | 38.2 years |
| Female Median Age | 44.7 years |
| Area Codes | 1 |
| Associated Cities | Budapest |
| Neighborhoods | Belváros, V. kerület |
| Timezone | Central European Summer Time |
| Coordinates | 47.49126221243368° / 19.05851393843245° |
| Related Postal Codes | 1041, 1042, 1043, 1044, 1045, 1051, 1052, 1054, 1055, 1056 |
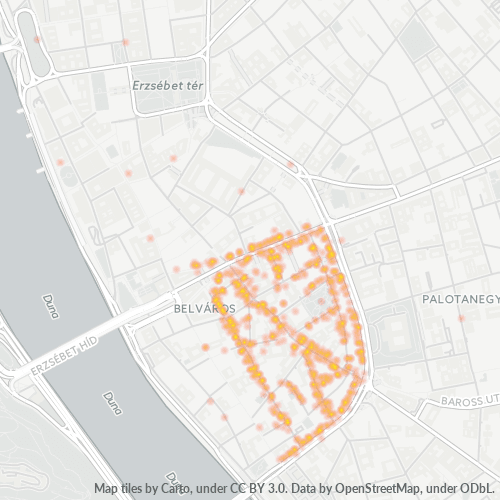
Map of Postal Code 1053 - Budapest X. kerület
Interactive Map
Postal Code 1053 - Budapest X. kerület Population
Years 1975 to 2030
| Data | 1975 | 1990 | 2000 | 2015 | 2020 | 2025* | 2030* |
|---|---|---|---|---|---|---|---|
| Population | 1,974 | 2,569 | 2,879 | 3,077 | 39,269 | 40,806 | 40,898 |
| Population Density | 8,051.5 / km² | 10,478.4 / km² | 11,742.8 / km² | 12,550.4 / km² | 160,169.8 / km² | 166,438.8 / km² | 166,814.1 / km² |
Postal Code 1053 - Budapest X. kerület Population change from 2000 to 2020
Increase of 1264% from year 2000 to 2020
| Location | Change since 1975 | Change since 1990 | Change since 2000 |
|---|---|---|---|
| Postal Code 1053 - Budapest X. kerület | +1889.3% | +1428.6% | +1264% |
| Budapest | +71.1% | +32.6% | +15.5% |
| Hungary | — | — | — |
Postal Code 1053 - Budapest X. kerület Median Age
Median Age: 41.8 years
| Location | Median Age | Median Age (Female) | Median Age (Male) |
|---|---|---|---|
| Postal Code 1053 - Budapest X. kerület | 41.8 yrs | 44.7 yrs | 38.2 yrs |
| Budapest | 40.9 yrs | 43.2 yrs | 38.2 yrs |
| Hungary | 41 yrs | 43.2 yrs | 38.6 yrs |
Postal Code 1053 Population Density
Population Density: 160,170 / km²
| Location | Population | Area | Density |
|---|---|---|---|
| Postal Code 1053 | 39,269 | 0.245 km² | 160,170 / km² |
| Budapest | 1.8 million | 525.3 km² | 3,387 / km² |
| Hungary | 9.8 million | 93,010.9 km² | 106 / km² |
Postal Code 1053 - Budapest X. kerület Historical and Projected Population
Estimated Population from 1950 to 2100
- JRC (European Commission's Joint Research Centre) work on the GHS built-up grid
- CIESIN (Center for International Earth Science Information Network)
- [Link] Klein Goldewijk, K., Beusen, A., Doelman, J., and Stehfest, E.: Anthropogenic land use estimates for the Holocene – HYDE 3.2, Earth Syst. Sci. Data, 9, 927–953, https://doi.org/10.5194/essd-9-927-2017, 2017.
Neighborhoods
Business Distribution by neighborhood in Postal Code 1053 - Budapest X. kerület
Area Codes
Percentage Area Codes used by businesses in Postal Code 1053 - Budapest X. kerület
Industries
Business Distribution by Industry in Postal Code 1053 - Budapest X. kerület
| Industry Description | Number of Establishments |
|---|---|
| Art galleries | 38 |
| Bars, pubs and taverns | 26 |
| Book stores and newsstands | 29 |
| Cafes | 36 |
| Clothing stores | 30 |
| Construction of buildings | 31 |
| Corporate management | 41 |
| Hotels and motels | 39 |
| Lawyers legal | 26 |
| Other accommodation | 90 |
| Restaurants | 115 |
| Shopping | 50 |
Business distribution by price for Postal Code 1053 - Budapest X. kerület
Human Development Index (HDI)
Statistic composite index of life expectancy, education, and per capita income.
Postal Code 1053 CO2 Emissions
Carbon Dioxide (CO2) Emissions Per Capita in Tonnes Per Year
| Location | CO2 Emissions | CO2 Emissions Per Capita | CO2 Emissions Intensity |
|---|---|---|---|
| Postal Code 1053 | 238,949 tn | 6.08 tn | 974,620.8 tons/km² |
| Budapest | 10,816,217 tn | 6.08 tn | 20,592.5 tons/km² |
| Hungary | 48,384,016 tn | 4.92 tn | 520.2 tons/km² |
| 2013 CO2 emissions (tonnes/year) | 238,949 tn |
| 2013 CO2 emissions (tonnes/year) per capita | 6.08 tn |
| 2013 CO2 emissions intensity (tonnes/km²/year) | 974,620.8 tons/km² |
Natural Hazards Risk
Relative risk out of 10
| Hazard | Risk Level |
|---|---|
| Earthquake | Medium (4) |
Recent Nearby Earthquakes
Magnitude 3.0 and greater
| Date▼ | Time↕ | Magnitude↕ | Distance↕ | Depth↕ | Location↕ | Link |
|---|---|---|---|---|---|---|
| 1/18/14 | 5:34 PM | 4 | 66.1 km | 3,100 m | 4km ESE of Balassagyarmat, Hungary | usgs.gov |
| 6/5/13 | 11:45 AM | 4.1 | 60.9 km | 6,200 m | 4km ENE of Ersekvadkert, Hungary | usgs.gov |
| 4/22/13 | 3:28 PM | 4.4 | 89.2 km | 13,000 m | 1km WNW of Heves, Hungary | usgs.gov |
| 1/29/11 | 9:41 AM | 4.3 | 55.3 km | 10,000 m | Hungary | usgs.gov |
| 12/31/06 | 5:39 AM | 4.1 | 22 km | 5,200 m | Hungary | usgs.gov |
| 9/15/06 | 2:02 PM | 3.1 | 56.7 km | 10,000 m | Hungary | usgs.gov |
| 9/22/04 | 10:32 PM | 3.5 | 88.2 km | 7,500 m | Slovakia | usgs.gov |
| 8/18/04 | 2:01 AM | 3.3 | 88.6 km | 10,000 m | Hungary | usgs.gov |
| 8/17/04 | 11:00 AM | 3.4 | 86.2 km | 10,000 m | Hungary | usgs.gov |
| 6/21/03 | 1:05 PM | 3.8 | 61 km | 10,000 m | Hungary | usgs.gov |
About Our Data
The data on this page is estimated using a number of publicly available tools and resources. It is provided without warranty, and could contain inaccuracies. Use at your own risk.