Pin Code 505122 - India
India
| Area of Pin Code 505122 | 119.1 km² |
| Population | 82,211 |
| Male Population | 41,599 (50.6%) |
| Female Population | 40,612 (49.4%) |
| Population change from 1975 to 2015 | +52.6% |
| Population change from 2000 to 2015 | +9.7% |
| Median Age | 28.5 years |
| Male Median Age | 28 years |
| Female Median Age | 29.1 years |
| Neighborhoods | Durga Colony, Shivanagar |
| Timezone | India Standard Time |
| Coordinates | 18.268346749287726° / 79.5039374531716° |
| Related Pin Codes | 505101, 505129, 505153, 505162, 505172, 505174, 505184, 505185, 505186, 505187 |
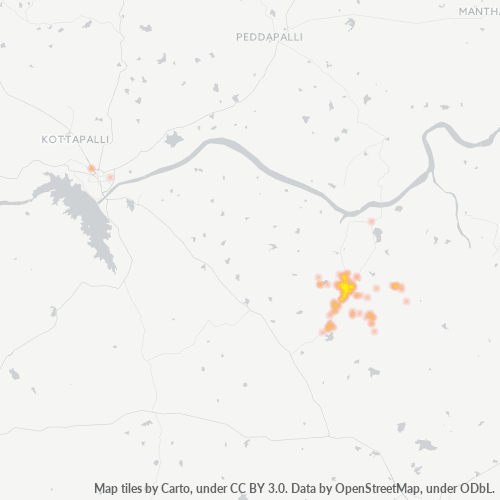
Map of Pin Code 505122 - India
Interactive Map
Pin Code 505122 - India Population
Years 1975 to 2020
| Data | 1975 | 1990 | 2000 | 2015 | 2020 |
|---|---|---|---|---|---|
| Population | 53,864 | 67,475 | 74,952 | 82,211 | 87,781 |
| Population Density | 452.1 / km² | 566.4 / km² | 629.1 / km² | 690.1 / km² | 736.8 / km² |
Sources: JRC (European Commission's Joint Research Centre) work on the GHS built-up grid
Pin Code 505122 - India Population change from 2000 to 2015
Increase of 9.7% from year 2000 to 2015
| Location | Change since 1975 | Change since 1990 | Change since 2000 |
|---|---|---|---|
| Pin Code 505122 - India | +52.6% | +21.8% | +9.7% |
| India | +111.1% | +50.6% | +24.5% |
Sources: JRC (European Commission's Joint Research Centre) work on the GHS built-up grid
Pin Code 505122 - India Median Age
Median Age: 28.5 years
| Location | Median Age | Median Age (Female) | Median Age (Male) |
|---|---|---|---|
| Pin Code 505122 - India | 28.5 yrs | 29.1 yrs | 28 yrs |
| India | 24.9 yrs | 25.4 yrs | 24.5 yrs |
Sources: CIESIN (Center for International Earth Science Information Network)
Pin Code 505122 Population Density
Population Density: 690 / km²
| Location | Population | Area | Density |
|---|---|---|---|
| Pin Code 505122 | 82,211 | 119.1 km² | 690 / km² |
| India | 1,307 million | 3,083,563.4 km² | 424 / km² |
Sources: JRC (European Commission's Joint Research Centre) work on the GHS built-up grid
Pin Code 505122 - India Historical and Projected Population
Estimated Population from 0 to 2100
Sources:
- JRC (European Commission's Joint Research Centre) work on the GHS built-up grid
- CIESIN (Center for International Earth Science Information Network)
- [Link] Klein Goldewijk, K., Beusen, A., Doelman, J., and Stehfest, E.: Anthropogenic land use estimates for the Holocene – HYDE 3.2, Earth Syst. Sci. Data, 9, 927–953, https://doi.org/10.5194/essd-9-927-2017, 2017.
Neighborhoods
Business Distribution by neighborhood in Pin Code 505122 - India
Business Concentration in Pin Code 505122 - India
Industries
Business Distribution by Industry in Pin Code 505122 - India
| Industry Description | Number of Establishments | Average Google Rating |
|---|---|---|
| All food and beverage | 20 | 4.2 |
| Banks | 9 | 3.8 |
| Business services | 5 | 4.6 |
| Clothing stores | 13 | 4.1 |
| Department stores | 27 | 4 |
| Education | 19 | 4.1 |
| Electronics stores | 7 | 4.1 |
| Grocery stores and supermarkets | 16 | 4 |
| Health and medical | 6 | 3.5 |
| Higher education (colleges and universities) | 11 | 3.7 |
| Hindu temple | 11 | 4.2 |
| Hospitals | 17 | 3.5 |
| Internet cafes | 6 | 2.5 |
| Loan companies | 12 | 3.8 |
| Other accommodation | 6 | 3.6 |
| Photography | 6 | 4.4 |
| Public administration | 7 | 4.3 |
| Real estate | 5 | 3.7 |
| Religion | 15 | 4.5 |
| Shopping | 139 | 4.1 |
| Shopping other | 6 | 4.7 |
Human Development Index (HDI)
Statistic composite index of life expectancy, education, and per capita income.
Source: [Link] Kummu, M., Taka, M. &Guillaume, J. Gridded global datasets for Gross Domestic Product and Human Development Index over 1990–2015. Sci Data 5, 180004 (2018) doi:10.1038/sdata.2018.4
Pin Code 505122 CO2 Emissions
Carbon Dioxide (CO2) Emissions Per Capita in Tonnes Per Year
| Location | CO2 Emissions | CO2 Emissions Per Capita | CO2 Emissions Intensity |
|---|---|---|---|
| Pin Code 505122 | 132,297 tn | 1.61 tn | 1,110.5 tons/km² |
| India | 1,928,568,344 tn | 1.48 tn | 625.4 tons/km² |
Sources: [Link] Moran, D., Kanemoto K; Jiborn, M., Wood, R., Többen, J., and Seto, K.C. (2018) Carbon footprints of 13,000 cities. Environmental Research Letters DOI: 10.1088/1748-9326/aac72a
Pin Code 505122 CO2 Emissions
| 2013 CO2 emissions (tonnes/year) | 132,297 tn |
| 2013 CO2 emissions (tonnes/year) per capita | 1.61 tn |
| 2013 CO2 emissions intensity (tonnes/km²/year) | 1,110.5 tons/km² |
Natural Hazards Risk
Relative risk out of 10
| Hazard | Risk Level |
|---|---|
| Drought | Medium (5) |
| Flood | High (8) |
* Risk, particularly concerning flood or landslide, may not be for the entire area.
About Our Data
The data on this page is estimated using a number of publicly available tools and resources. It is provided without warranty, and could contain inaccuracies. Use at your own risk.